Rubber Ducky Logs
- That can’t happen.
- That doesn’t happen on my machine.
- That shouldn’t happen.
- Why does that happen?
- Oh, I see.
- How did that ever work?
I hate debugging. Anyone that’s worked at a desk near mine has likely witnessed my debugging cycle of rage, insight, disbelief, and existential despair. The end condition of this cycle is either success or reluctant resignation, with the occasional therapeutic Reddit break (cute animals are an emotional force to be reckoned with).
From the years I’ve spent writing and debugging code, I can only really offer a few pieces of general advice.
- Confirm your assumptions. Is this function really getting called? Do I really understand the documented behaviour of the library? Do I really understand the language constructs I’m using? Does the library actually do what it says it does?
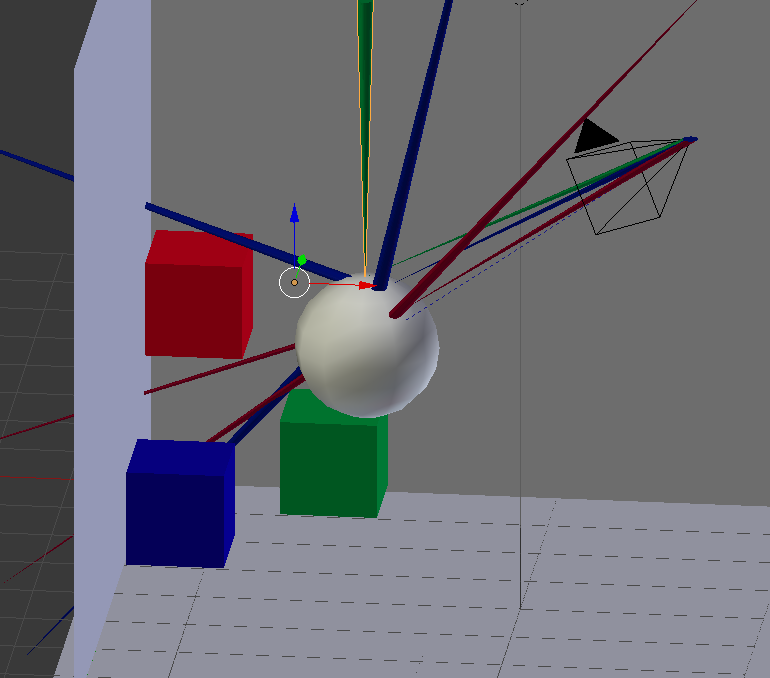
- Get more information. Log everything. The presence and order of your logs are invaluable for seeing what’s happening. If they’re too noisy, be intelligent with your logs. Format them hierarchically, output an image, output something machine readable so you can manipulate it. My most ridiculous example of this came from debugging a raytracer, where I output coordinates then plotted the rays manually in Blender.
- Make a minimal test case. Try to remove as many variables as you possibly can while still demonstrating the bug. Rule out as many possible causes as possible by deleting modules, files, and lines of code. Try to reproduce the bug outside your codebase entirely. Open source maintainers will love you, and you now have something you can dump on IRC.
- Know when to leave your desk. It hurts programmers to leave their desk when they’ve got a full context on a problem, but sometimes you need to step away and let it simmer in the back of your head for a while.
- Use a Rubber Ducky.
Many programmers have had the experience of explaining a programming problem to someone else, possibly even to someone who knows nothing about programming, and then hitting upon the solution in the process of explaining the problem.
In describing what the code is supposed to do and observing what it actually does, any incongruity between these two becomes apparent. By using an inanimate object, such as a rubber duck, the programmer can try to accomplish this without having to involve another person.
Rubber Ducky Logs
At a previous job, I found myself repeatedly running into brick walls of bugs where I would run around in circles trying to locate the cause. My coworkers were helpful when available, but I was wary of breaking their flow, and occasionally I’d be debugging late into the night when nobody else was around.
As a means of maintaining sanity, and explaining why what should have been a simple change took me 2 days, I started writing what I’ll now lovingly call “Rubber Ducky Logs”.
Rubber ducky logs are simple text files I keep around and edit in vim that document my progress working through a bug. Here’s an excerpt from one of my most recent logs:
Finally got tests that load the entire shared package running in the
browser,
and now phantomjs is choking.

    TypeError: 'undefined' is not a function (evaluating 'RegExp.prototype.test.bind(
        /^(data|aria)-[a-z_][a-z\d_.\-]*$/
    )')

Very confused as to how this happens in phantom, but not chrome. Different
versions of V8? Wtf? (Postmortem note: phantom does not use V8, I was
totally wrong.)

Changing it to this seems to fix the problem:

    isCustomAttribute: function(name) {
        return /^(data|aria)-[a-z_][a-z\d_.\-]*$/.test(name);
    },

But now I'm getting failures that I don't see in the browser.

    Error: Load timeout for modules: package!dashboard.js_unnormalized2,package!dashboard.js,package!profile.js,template!profile.profile-tab-achievements
    http://requirejs.org/docs/errors.html#timeout
    http://localhost:1235/third_party/javascript-khansrc/requirejs/require.js : 138
    http://localhost:1235/third_party/javascript-khansrc/requirejs/require.js : 536
    http://localhost:1235/third_party/javascript-khansrc/requirejs/require.js : 691
    http://localhost:1235/third_party/javascript-khansrc/requirejs/require.js : 710
    Timeout: tests did not start. This may be because of errors on the page.

It seems to choke on

    require("package!dashboard.js");

shared.js and tasks.js both load just fine.

it chokes on profile.js

dashboard.js without the dependency on profile.js seems to work, so that
suggests the problem is in profile.js
The added benefit of having these logs is that I can reference them again when a coworker or I runs into similar problems.
A Heinous Bug
The motivation for this post came from debugging a particularly nasty bug where my original expectation of what was causing problems and the actual cause were surprisingly far apart.
My current task is to build client-side testing infrastructure. Tests are loaded using RequireJS, and are written against the Mocha testing framework. The tests can either be run in-browser for debugging, or headlessly in phantomjs. For integration with existing tooling, the test runners are written in python.
After addressing a minor problem in react.js that was causing it to fail loading in phantom, I started seeing another problem that I couldn’t reproduce in chrome.
Error: Load timeout for modules:
package!dashboard.js_unnormalized2,package!dashboard.js,package!profile.js,template!profile.profile-tab-achievements
http://requirejs.org/docs/errors.html#timeout
http://localhost:1235/third_party/javascript-khansrc/requirejs/require.js : 138
http://localhost:1235/third_party/javascript-khansrc/requirejs/require.js : 536
http://localhost:1235/third_party/javascript-khansrc/requirejs/require.js : 691
http://localhost:1235/third_party/javascript-khansrc/requirejs/require.js : 710
Timeout: tests did not start. This may be because of errors on the page.
At Khan Academy, static assets are bundled together in “packages” (not CommonJS
or node packages). I made a RequireJS loader plugin to load full packages
altogether, and it appeared to be timing out. I tried switching which packages
were being loaded and narrowed it down to a package called profile.js.
At this point, I tried narrowing it down further to a specific file in the
profile.js package. I systematically removed files and found that if I remove
the last 8 files in the package, the error disappeared.
“Great!”, I thought, “I’ve narrowed down the problem!”. So I tried removing all the files in the package except the last 8 files, and saw that the error also disappeared in that case. Damn.
At that point it’s around 2am and I was sitting in a bed in Lyon, France with an 8am wakeup call, so I decided to call it a night.
My debugging continued on the train from Lyon to Paris, and having left the keyboard to think for a while, I remembered that phantomjs is built on webkit, not chromium, so it’s actually using JavascriptCore, not V8. I tried loading up the tests in Safari and see that they run just fine though, so either it’s a different version of JavascriptCore, or I’m looking at the problem wrong.
I tried a little longer to narrow down the list of files in the package to see which combination of files was causing a failure, but it seems almost arbitrary which files’ removal fixed the problem.
At this point I had a theory: the problem is the sheer number of files, and not
which files in particular it is. I started wondering how that could be the case,
and my first two thoughts are ulimit and some limitation on external
resources on phantom.
Well, it can’t be ulimit because the number of files I’m opening is way under
the limit output by ulimit.
$ ulimit -a
-t: cpu time (seconds)         unlimited
-f: file size (blocks)         unlimited
-d: data seg size (kbytes)     unlimited
-s: stack size (kbytes)        8192
-c: core file size (blocks)    0
-v: address space (kb)         unlimited
-l: locked-in-memory size (kb) unlimited
-u: processes                  709
-n: file descriptors           2560
I made a package that contains 150 JS files that do nothing, and tried loading that. This also exhibits the problem, and only in phantom, so that supports my theory. This also rules out Mocha from being a contributor to the problem.
...
LOADED:  /javascript/foobar-package/x111.js
LOADED:  /javascript/foobar-package/x112.js
LOADED:  /javascript/foobar-package/x113.js
LOADED:  /javascript/foobar-package/x114.js
LOADED:  /javascript/foobar-package/x115.js
LOADED:  /javascript/foobar-package/x116.js
LOADED:  /javascript/foobar-package/x117.js
LOADED:  /javascript/foobar-package/x118.js
LOADED:  /javascript/foobar-package/x119.js
Error: Load timeout for modules: package!foobar.js_unnormalized2,package!foobar.js,/javascript/foobar-package/x120.js
http://requirejs.org/docs/errors.html#timeout
   http://localhost:1235/third_party/javascript-khansrc/requirejs/require.js : 138
   http://localhost:1235/third_party/javascript-khansrc/requirejs/require.js : 536
   http://localhost:1235/third_party/javascript-khansrc/requirejs/require.js : 691
   http://localhost:1235/third_party/javascript-khansrc/requirejs/require.js : 710
I figure I now had enough to make a minimal test case in a separate repository that I could bug people on IRC or github issues about, so I made a new git repo and tried to bring in only the components I needed. No repro. Damn.
I tried reducing the number of variables within the original repository. I
discovered I could reproduce using just using jQuery AJAX requests, so that
rules out RequireJS being a contributor. I also switched to getting .txt files
instead of .js files, which repros and ruled out the problem being isolated to
getting JS files.
I started bringing in more things from the original repo into the isolated one, including the python test runners. Suddenly I was able reproduce in the external repository.
All the python scripts do are boot a local static server by shelling out to
python -mSimpleHTTPServer and shell out to phantomjs. I tried doing these
two steps myself without using the subprocess module in between, and suddenly
the bug is gone.
But why is this only happening for phantom and not in chrome? Both of them shell
out to SimpleHttpServer. Investigating, I discovered the only difference is
that the phantom script invokes the web server with stderr=subprocess.PIPE to
silence the output of the server since it reports test results to the console,
whereas the chrome runner lets the logs pass through to the console since the
results are viewed in browser.
Googling around with this new kind of problem, I find this: Subprocess Hanging PIPE is your enemy.
It turns out that while the number of files was indirectly the cause, the real differentiating factor between it previously working in phantom and suddenly not was the size of the server logs. Once the web server had logged a certain amount, it blocked the process completely until the logs were flushed.
Switching from stderr=subprocess.PIPE to stderr=open(os.devnull, 'w+') fixes
the problem for good. Good grief.
You can read the whole verbatim rubber ducky log in this gist. The debug log actually starts with another painful problem that really was an issue with RequireJS.
The code, debugging session, and this subsequent post were all written while I’m travelling around Europe for a few months, and very gratefully working part time for the incredible Khan Academy. We’re always hiring both full timers and interns, so if you’re interested in working with world class engineers trying to deliver a free world class education to the world, go ahead and apply!