A Map of Everywhere My Family Has Ever Been
This is the background and tech teardown of making my Travel Map, which you should check out before reading this post. You can find the full source on github at jlfwong/travelmap.
Background
After I ended my 11 week tour of Western Europe, I felt it was my nerdy obligation to create some form of data visualization for the trip. I’d also been looking for an excuse to learn D3.js for some time. As a third stroke of luck, my mom just broke her foot (bear with me, I swear I’m not a terrible son). She was housebound and I know she absolutely hates being without things to keep her busy, so I gave her a gargantuan task. I asked her to help me collect a list of every city everyone in my immediate family had ever slept in, in order, including returning home (so Ottawa → Toronto → Ottawa).
While she was poring over old diaries and calendars, I got started reading. For getting a good overview on technical subjects now, I prefer starting with books over tutorials or blog posts because they tend to do a better job of giving me vocabulary to work with. After a brief look around, I settled upon Interactive Data Visualization for the Web, which I thoroughly enjoyed.
Data Format
I knew the data entry for this was going to be time consuming, and I’d be getting data in different formats from each of my family members, so I decided to opt for something simple. The data file is a JavaScript file which exports a mapping from the person’s name to the list of places they’ve been in order. So a (very) reduced version would look like this:
module.exports = {
  "Jamie": ["Ottawa", "Waterloo", "Toronto", "San Francisco", "Ottawa"]
  "Tammy": ["Ottawa", "Toronto", "Ottawa"],
  "Becky": ["Ottawa", "Winnipeg", "Ottawa", "Saskatoon"],
  "Emma": ["Ottawa", "Kingston", "Ottawa", "Vancouver"],
  "Susan": ["Sheffield, England", "Calgary", "Ottawa"],
  "Ging": ["Hong Kong", "Calgary", "Ottawa"]
}
The places listed are just strings containing human readable place names (usually cities).
After the data started pouring in, I realized that updating all of our lists for family trips and having massive data duplication was going to be a pain, especially for road trips with 10+ stops. I needed some way of saying “all of these people went on this trip”. I chose the first thing to come to mind: make each of these family trips an array, then just flatten each person’s list before it got processed. So to add a shared trip which I went on with my parents and one of my sisters, it would look like this:
var ROADTRIP = [
  "Kalamazoo, Michigan",
  "Chicago, Illinois",
  "Mt Rushmore, South Dakota",
  "Calgary",
  "Windermere, Canada",
  "Waterton, Alberta",
  "Ottawa"
];

module.exports = {
  "Jamie": ["Ottawa", ROADTRIP, "Waterloo", "Toronto", "San Francisco", "Ottawa"]
  "Tammy": ["Ottawa", ROADTRIP, "Toronto", "Ottawa"],
  "Becky": ["Ottawa", "Winnipeg", "Ottawa", "Saskatoon"],
  "Emma": ["Ottawa", "Kingston", "Ottawa", "Vancouver"],
  "Susan": ["Sheffield, England", "Calgary", "Ottawa", ROADTRIP],
  "Ging": ["Hong Kong", "Calgary", "Ottawa", ROADTRIP]
};
You can see what the full dataset looks like in app/data.js.
Geocoding
The data processing phase consists of a pretty normal pattern for data
transformation: a series of map’s (the functional kind, not the geographic
kind – transforming every data point in isolation), followed by a series of
reduce’s (using the result of all the map calls to produce interesting data
and statistics at the end).
In order to plot all these locations on a map, I need to know the corresponding longitude and latitude for each place. The process of converting human readable addresses into longitude and latitude is called “geocoding”. Google Maps and OpenStreetMap both provide a geocoding service. I opted for the OpenStreetMap version because it’s very, very simple to use, and I found it gave me good enough results. An example geocoding query looks like this:
http://nominatim.openstreetmap.org/search/?q=Paris&format=json
I was also interested in some additional information about each place, most importantly the containing country. Once I have the longitude and latitude of each place, I can request more information about what exactly exists at those coordinates by performing “reverse geocoding”. OpenStreetMap conveniently also provides this as a service. An example reverse geocoding query looks like this:
http://nominatim.openstreetmap.org/reverse?lat=48.8565056&lon=2.3521334&zoom=8&format=json
You can see the full data processing pipeline in app/aggregate.js
Promises
The data retrieval and transformation pipeline here gets pretty complicated, so
I was grateful to make use of Promises. Domenic Denicola does a good job
explaining the benefits of promises in his article You’re Missing the Point of
Promises. He also points out the sad mutability of jQuery’s
Deferred objects, but I thankfully didn’t run into any of those
problems.
I’ll leave you to read that Domenic’s post to argue for the virtues of promises and focus this section on going over the 3 different ways I used promises to build the map.
Transforming Asynchronous Results
The first is to perform data transformations on the result of an asynchronous
request, as is used in the geocode function. If a then callback returns a
value, then the resulting promise will be immediately resolved with the result.
var geocode = function (q) {
  return $.ajax("http://nominatim.openstreetmap.org/search/", {
    data: {
      q: q,
      format: "json"
    }
  }).then(function(data) {
    if (!data || !data[0]) {
      throw new Error("Geocoding '" + q + "' failed.");
    }
    return {
      lat: parseFloat(data[0].lat, 10),
      lon: parseFloat(data[0].lon, 10)
    };
  });
};
This allows a usage pattern like this:
geocode("paris").then(function(coords) { console.log(coords) });
// Object {lat: 48.8565056, lon: 2.3521334}
Without promises, this would look like this:
var geocode = function(q, cb) {
  return $.ajax("http://nominatim.openstreetmap.org/search/", {
    data: {
      q: q,
      format: "json"
    },
    success: function(data) {
      if (!data || !data[0]) {
        throw new Error("Geocoding '" + q + "' failed.");
      }
      cb({
        lat: parseFloat(data[0].lat, 10),
        lon: parseFloat(data[0].lon, 10)
      });
    }
  });
};
Serial Requests
The second use case is to send a number of requests in series, using data retrieved from one request as parameters to the next.
Let’s say you wanted to geocode a place name, then use the resulting coordinates to perform a reverse geocode.
var biGeocode = function(q) {
  var data = {};
  return geocode(q).then(function(coords) {
    data.forward = coords;
    return geocode.reverse(coords);
  }).then(function(description) {
    data.reverse = description;
    return data;
  });
};
This would then be usable like this:
biGeocode("paris").then(function(data) {
  var fwd = data.forward;
  var rev = data.reverse;
  console.log(
    "paris (" + fwd.lat + "," + fwd.lon + ") is in " +
    rev.address.country
  );
});
// paris (48.8565056,2.3521334) is in France
The callback version for comparison:
var biGeocode = function(q, cb) {
  geocode(q, function(coords) {
    geocode.reverse(coords, function(description) {
      cb({
        forward: coords,
        reverse: description
      });
    ));
  });
};
Parallel Requests
If I’m trying to send a bunch of independent requests, it doesn’t make sense to
queue them up. I want to make as many requests in parallel as the browser will
let me. Let’s say for instance, I wanted to geocode a list of places. I can use
jQuery’s handy $.when.
For a simple first example, let’s say I just wanted to do this once off, with a known list of places.
$.when(
  geocode("Paris, France"),
  geocode("Toronto, Canada"),
  geocode("Waterloo, Canada")
).then(function(parisCoords, torontoCoords, waterlooCoords) {
  console.table({
    "paris": parisCoords,
    "toronto": torontoCoords,
    "waterloo": waterlooCoords
  });
});
And the callback version:
var pendingRequests = 3;
var results = {};
var parisCoords, torontoCoords, waterlooCoords;
var done = function() {
  if (pendingRequests-- == 0) {
    console.table({
      "paris": parisCoords,
      "toronto": torontoCoords,
      "waterloo": waterlooCoords
    });
  }
};

geocode("Paris, France", function(coords) {
  parisCoords = coords;
  done();
});

geocode("Toronto, Canada", function(coords) {
  torontoCoords = coords;
  done();
});

geocode("Waterloo, Canada", function(coords) {
  waterlooCoords = coords;
  done();
});
Now let’s look at a more general case: geocoding an arbitrary list of places.
var batchGeocode = function(places) {
  return $.when.apply($.when, places.map(geocode)).then(function() {
    return Array.prototype.slice.apply(arguments);
  });
};
Which could then be used like this:
batchGeocode([
  "Paris, France",
  "Toronto, Canada",
  "Waterloo, Canada"
]).then(function(coords) {
  console.table({
    "paris": coords[0],
    "toronto": coords[1],
    "waterloo": coords[2]
  });
});
If the above looks arcane to you, you may wish to read about .apply,
.prototype, and arguments. The Array.prototype.slice.apply call
is to convert the arguments object into a proper Array instance. This also
assumes either your browser natively supports .map or you have
es5-shim on the page.
The equivalent code using callbacks:
var batchGeocode = function(places, cb) {
  var pendingRequests = places.length;
  var result = places.map(function() { return null; });
  places.forEach(function(place, i) {
    geocode(place, function(coords) {
      result[i] = coords;
      if (pendingRequests-- == 0) {
        cb(result);
      }
    });
  });
};
Rendering
All of the interesting rendering is done using D3 to manipulate SVG. After looking through a bunch of D3 examples, including the mesmerizing projection transitions, I settled on using Mike Bostock’s World Map bl.ock as a reference point. The key bit of magic for rendering the points on the map comes from D3’s geo projections.
Projections
Geo projections convert from a (longitude, latitude) pair to an (x, y) coordinate given a kind of map projection and dimensions. I used the Mercator projection because it’s so familiar, and because I’m not really that into maps.
Because of the beautiful interface of D3’s geo projections, I was able to project the same data at several different granularities. The original version showed only the world map, but after I loaded in all the data, it was impossible to see any meaningful patterns in Europe or in the UK at that scale because of the density. I ended up using 4 different projections, all Mercator, specified by differing lat/lon bounding boxes.
You can see all the projections I used in app/projections.js.
Places and Paths
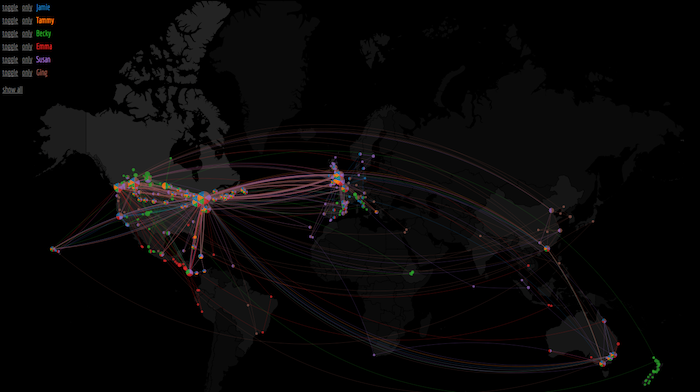
Using these wonderful geo projections, I was able to lay down markers for all the places we’d been and the paths we took to get there.
Each different color represents one of the people in my family. The colors were
selected using the D3’s categorical colors made available through
d3.scale.category10.
Each different place is indicated by a circle or a pie slice, generated using
d3.svg.arc. If a person’s color is part of the pie, it means they’ve
been to that place. The more times anyone has visited the place, the larger the
pie, following a logarithmic scale. If I did this on a linear, or even square
root scale, the places my family members have called home (particularly my
hometown of Ottawa) would’ve ended up dominating the map far too much.
The arcs joining places represent the paths that people took. You can tell which direction the path was in (i.e. differentiate between a path A → B and B → A) by looking at the direction of curvature. An upward inflection on the arc indicates travel East, downward inflection indicates travel West, and similarly leftward for North and rightward for South. Because I wanted to make commonly traveled back-and-forth routes apparent, I jitter the arc radius so that each back-and-forth arc is slightly offset from previous ones. If you show only me (Jamie) when viewing North America, you can clearly see my repeated trips from Toronto to San Francisco and back for internships.
All of the pie slices for places and arcs for paths have a CSS class attached to
them matching the name of the person they correspond to. This makes hiding or
showing all of them a simple matter of selecting everything with that class and
setting their CSS display property.
Animating
To stagger the animation of all the places and paths, I used the .transition,
.delay, .duration triplet described very clearly in the “Please Do Not
Delay” section of Interactive Data Visualization for the Web.
The places animate over fill-opacity. The path arcs actually have a more
complex animation that you can see above that animates stretching out the arc
from the source to the destination. In the real version, however, the animation
happens so fast that you can’t really tell. Regardless of the number of paths
or arcs on each map, the total animation time is constant. This means the
animations on the world map are faster, because there are so many more places
and arcs as compared to the map of Europe.
The animations are triggered when the middle of the map hits the bottom of the browser viewport as you scroll. The jQuery Waypoints plugin makes this really easy. I use a slightly modified version of the same plugin to stick the toggles in the top left of the screen only after you’ve scrolled past them.
Brunch
When I’m working on these small Something out of Nothing projects of my own, I like working with a static app, because it means deploying it is as simple as uploading some assets to my VPS and letting nginx serve it. Having done a few projects like this, I’ve temporarily settled on using Brunch for developing and producing the final static assets.
This allows me to work with files that need preprocessing and allows me to use
the CommonJS-esque require() provided by Brunch (though I’ll likely be
switching to Browserify for the next project), and transpiled languages
like CoffeeScript and Stylus. Because I’ve been working a lot more
in straight JavaScript than CoffeeScript recently, I decided to work without
CoffeeScript for this project, though it’s interesting to note that the chaining
syntax used extensively in jQuery and D3 just got sugary support in CoffeeScript
two years after the proposal in coffee-script#3263.
Caching in LocalStorage
To make this run completely serverless and to keep a good workflow between vim and the browser, I decided to make all the geocoding requests from the clientside. This is easy to do, but I wanted to avoid making thousands of AJAX requests on page load, so I needed to cache the results somehow.
Lo-Dash and Underscore both provide a _.memoize function
which caches the results of expensive computations. This works great for
repeated operations within a single page session, but I wanted to cache to be
warm after a page reload, so I store the results in localStorage. I also
wanted to change the default behaviour of _.memoize only caching based on the
first argument.
After I coded away a solution for doing this with general functions, I realized
all of my use cases for it actually involved caching the results of promises,
not synchronous function calls. This requires special handling, because I don’t
want to cache the promise itself, I want to cache the value the promise resolved
to. The result was the localStorageMemoize.promise function you can see in
app/lib/localstorage_memoize.js.
Given the promise-based geocode function discussed above, a cached version of
this looks like so:
var cachedGeocode = localStorageMemoize.promise("geocoder", geocode);
cachedGeocode("paris").then(function(coords) { console.log(coords); });
On the first page load, the above will make the AJAX request, but on subsequent
page loads it’ll use the value cached in localStorage.
But what about deploying? Having all of these results cached in localStorage
is fine and dandy for developing locally, but you don’t want every visitor to
the page waiting for thousands of AJAX requests to finish on their first page
load. Having a speedy second load doesn’t matter if nobody sticks around long
enough for the first one to finish.
My solution was to provide the ability to pre-load the cache with a JSON blob.
From my dev environment which already has everything cached, I download the
contents of the localStorage keys I’m interested in to disk using a clever
little script originally called console.save.
While this works and was an interesting exploration, it’s absolutely solving the wrong problem. A much more sensible solution would be to just do all this processing offline and produce a single JSON file containing all the data post-geocoding and aggregation. This would’ve complicated my workflow a little locally, but is definitely a more sensible solution in general.