Reverse Engineering Instruments’ File Format
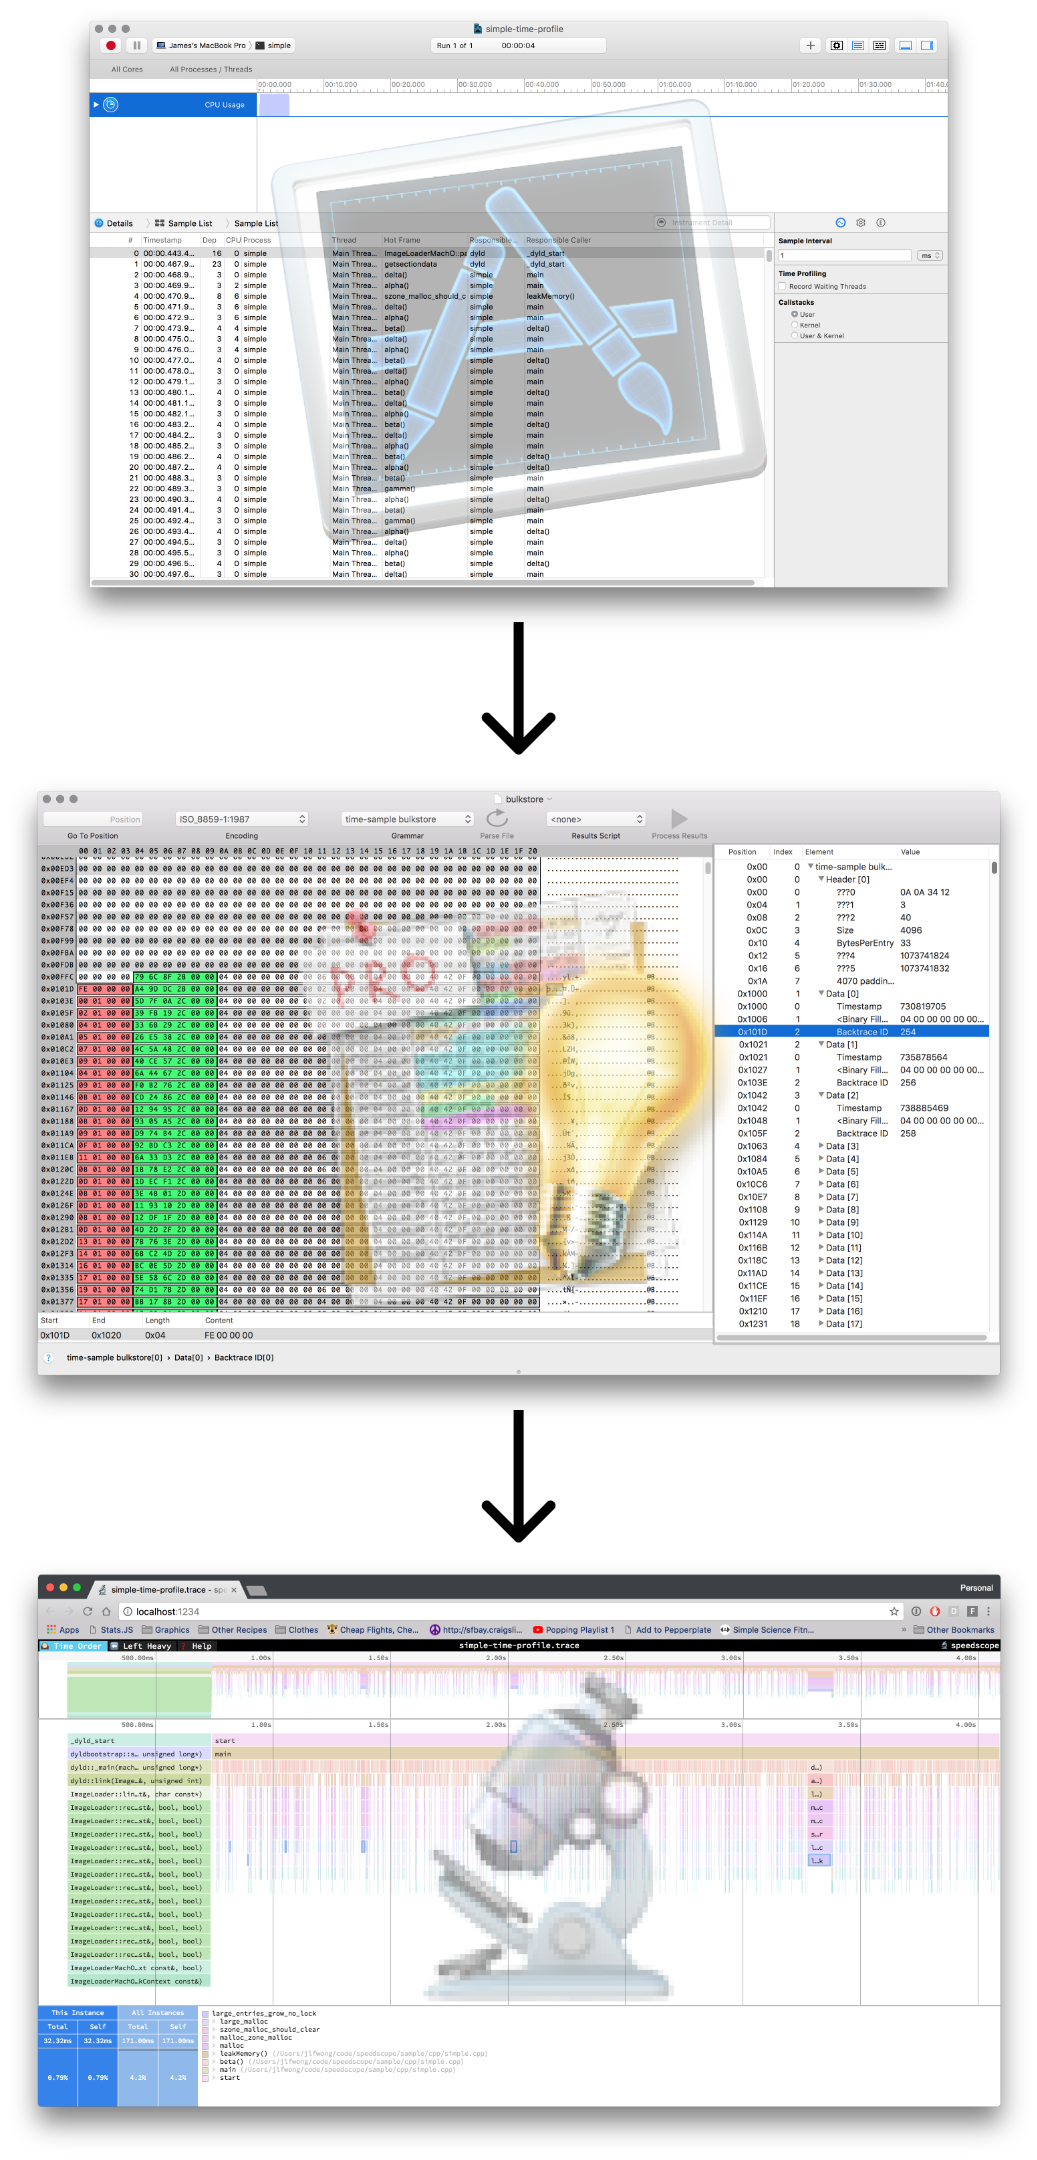
Have you ever wondered how applications store their data? Plenty of file formats like MP3 and JPG are standardized and well documented, but what about custom, proprietary file formats? What do you do when you want to extract data that you know is in a file somewhere, and there are no APIs to extract it?
Over the last few months, I’ve been building a performance visualization tool called speedscope. It can import CPU profile formats from a variety of sources, like Chrome, Firefox, and Brendan Gregg’s stackcollapse format.
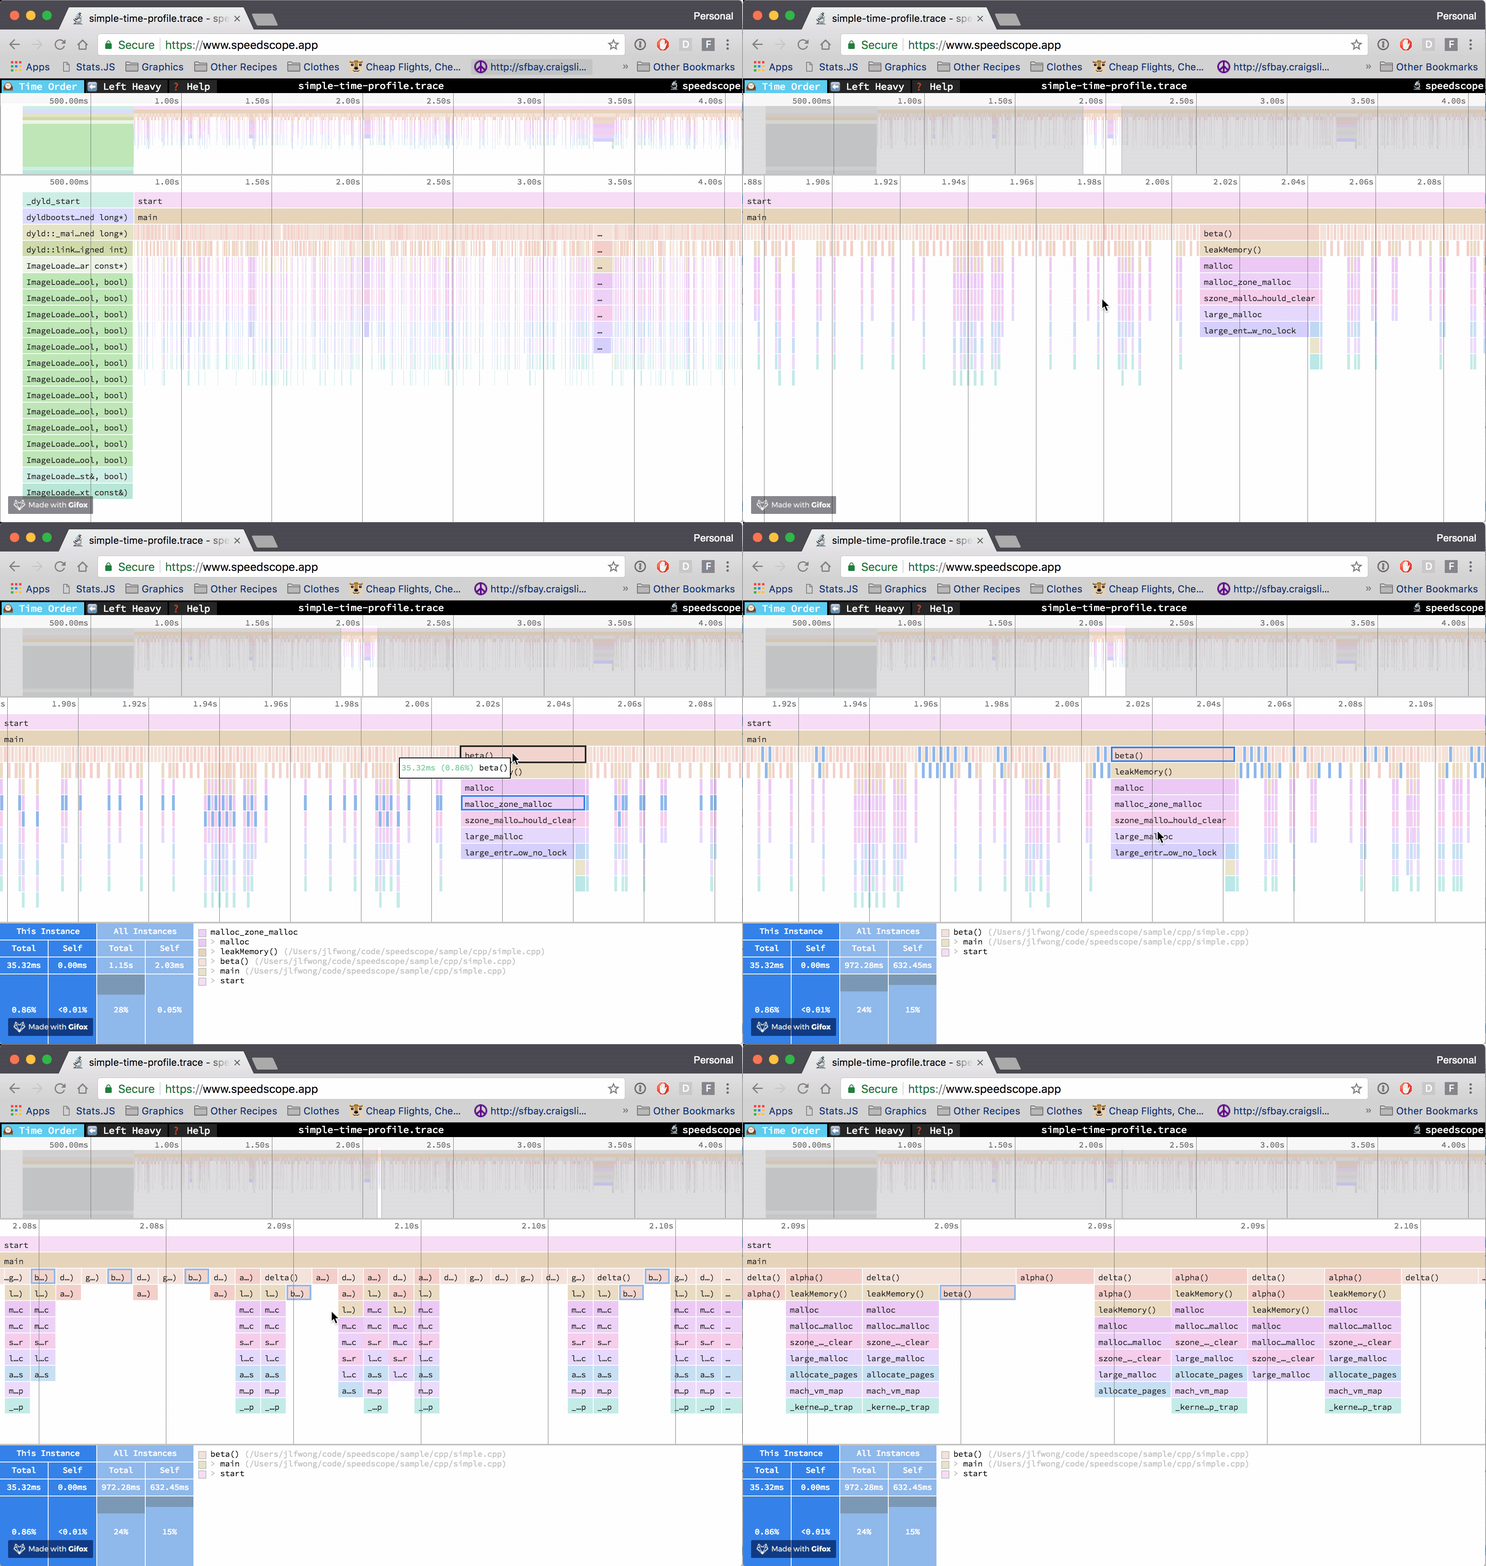
At Figma, I work in a C++ codebase that cross-compiles to asm.js and WebAssembly to run in the browser. Occasionally, however, it’s helpful to be able to profile the native build we use for development and debugging. The tool of choice to do that on OS X is Instruments. If we can extract the right information from the files Instruments outputs, then we can construct flamecharts to help us build intuition for what’s happening while our code is executing.
Up until this point, all of the formats I’ve been importing into speedscope have been either plaintext or JSON, which lends them to easier analysis. Instruments’ .trace file format, by contrast, is a complex, multi-encoding format which seems to use several hand-rolled binary formats.
This was my first foray into complex binary file reverse engineering, and I’d like to share my process for doing it, hopefully teaching you about some tools along the way.
Disclaimer: I got stuck many times trying to understand the file format. For the sake of brevity, what’s presented here is a much smoother process than I really went. If you get stuck trying to do something similar, don’t be discouraged!
A brief introduction to sampling profilers
Before we dig into the file format, it will be helpful to understand what kind of data we need to extract. We’re trying to import a CPU time profile, which helps us answer the question “where is all the time going in my program?” There are many different ways to analyze runtime performance of a program, but one of the most common is to use a sampling profiler.
While the program being analyzed is running, a sampling profiler will periodically ask the running program “Hey! What are you doing RIGHT NOW?”. The program will respond with its current call stack is (or call stacks, in the case of a multithreaded program), then the profiler will record that call stack along with the current timestamp. A manual way of doing this if you don’t have a profiler is to just repeatedly pause the program in a debugger and look at the call stack.
Instruments’ Time Profiler is a sampling profiler.
After you record a time profile in Instruments, you can see list of samples with their timestamps and associated call stacks.
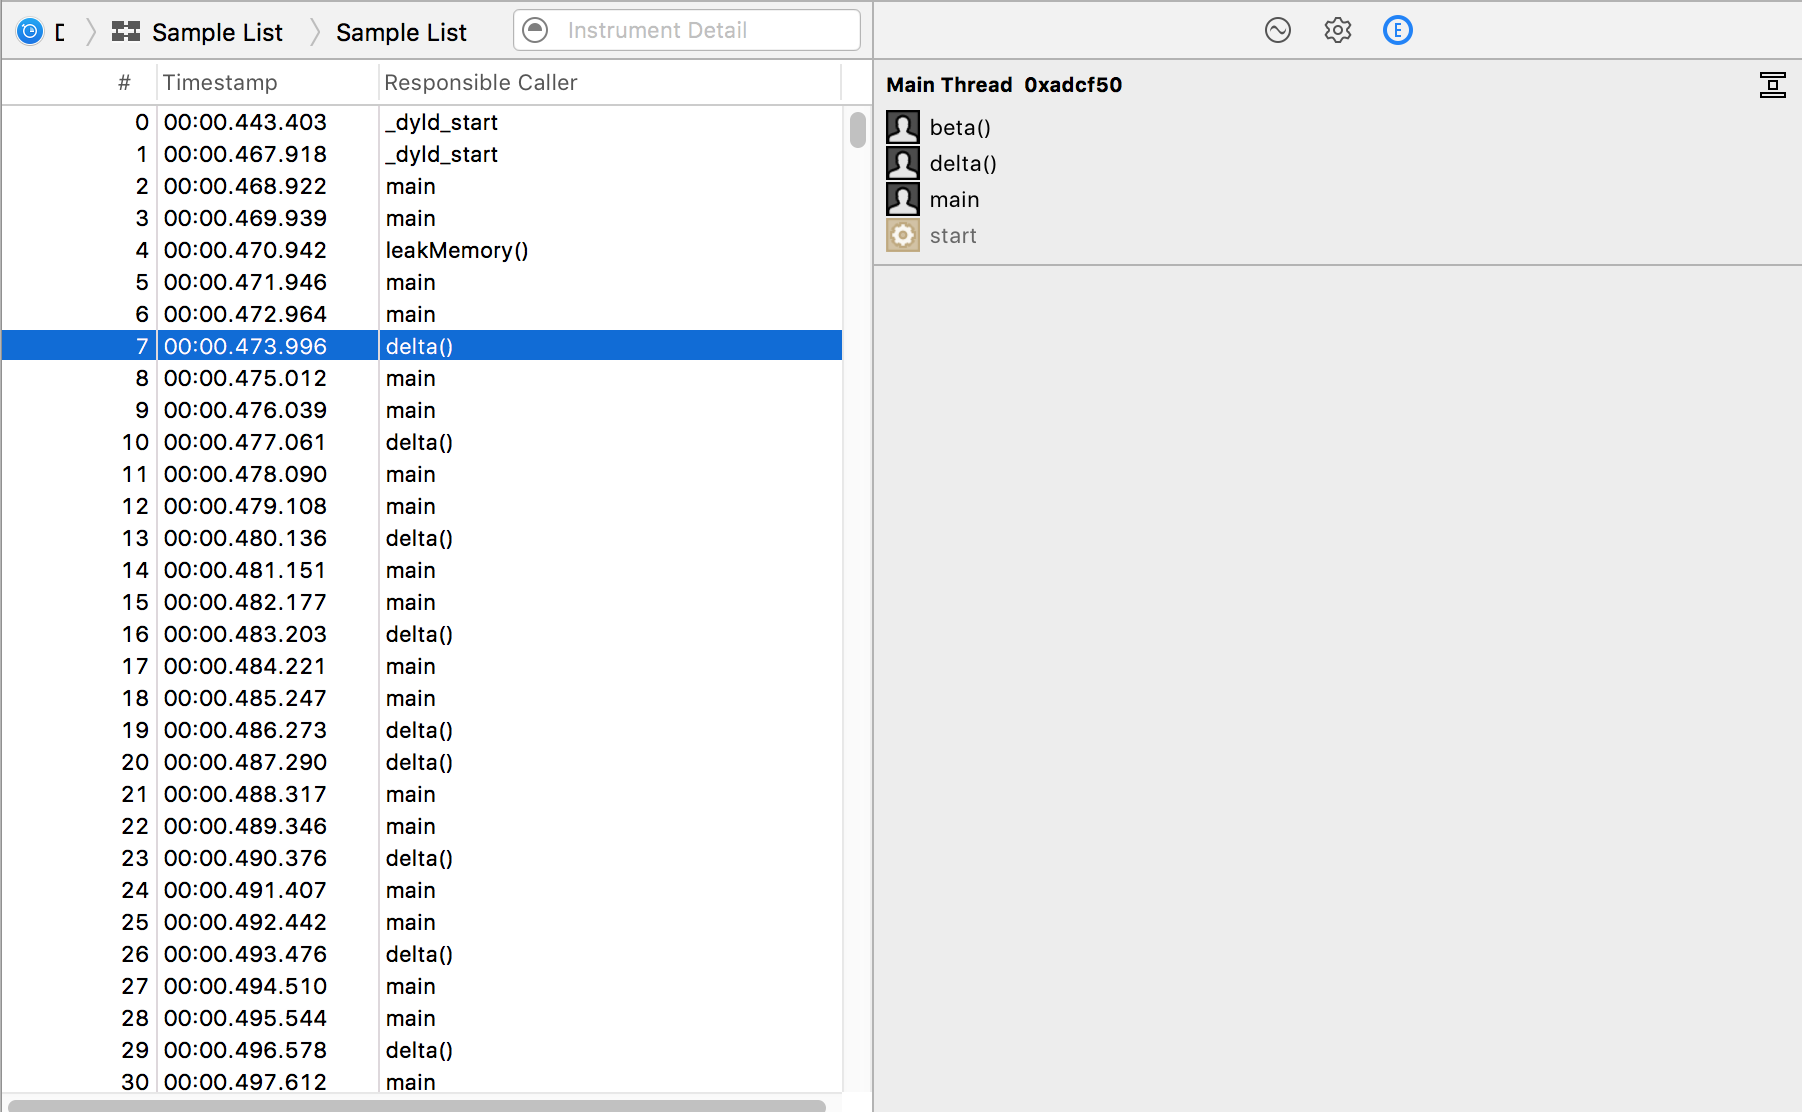
This is exactly the information we want to extract: timestamps, and call stacks.
Exploring with file and tree
If you’d like to follow along with these steps, you can find my test file here: simple-time-profile.trace, which is a profile from Instruments 8.3.3. This is a time profile of a simple program I made specifically for analysis without any complex threading or multi-process behaviour: simple.cpp.
A good first step when trying to analyze any file is to use the unix file program.
file will try to guess the type of a file by looking at its bytes. Here are some examples:
$ file favicon-16x16.png
favicon-16x16.png: PNG image data, 16 x 16, 8-bit colormap, non-interlaced
$ file favicon.ico
favicon.ico: MS Windows icon resource - 3 icons, 48x48, 256-colors
$ file README.md
README.md: UTF-8 Unicode English text, with very long lines
$ file /Applications/Google\ Chrome.app/Contents/MacOS/Google\ Chrome
/Applications/Google Chrome.app/Contents/MacOS/Google Chrome: Mach-O 64-bit executable x86_64
So let’s see what file has to say about our .trace file.
$ file simple-time-profile.trace
simple-time-profile.trace: directory
Interesting! So the Instruments .trace file format isn’t a single file, but a directory.
macOS has a concept of a bundle, which is effectively a directory that can act like a file. This allows many different file formats to be packaged together into a single entity. Other file formats like Java’s .jar and Microsoft Office’s .docx. accomplish similar goals by grouping many different file formats together in a zip compressed archive (they’re literally just zip archives with different file extensions).
With that in mind, let’s take a look at the directory structure using the tree command, installed on my Mac via brew install tree.
$ tree -L 4 simple-time-profile.trace
simple-time-profile.trace
├── Trace1.run
│   ├── RunIssues.storedata
│   ├── RunIssues.storedata-shm
│   └── RunIssues.storedata-wal
├── corespace
│   ├── MANIFEST.plist
│   ├── currentRun
│   │   └── core
│   │       ├── extensions
│   │       ├── stores
│   │       └── uniquing
│   └── run1
│       └── core
│           ├── core-config
│           ├── extensions
│           ├── stores
│           ├── table-manager
│           └── uniquing
├── form.template
├── instrument_data
│   └── 20202640-0B46-4698-ADAD-DF54B3ABE816
│       └── run_data
│           └── 1.run.zip
├── open.creq
└── shared_data
    └── 1.run
…okay then! There’s a lot going on in here, and it’s not clear where we should be looking for the data we’re interested in.
Finding strings with grep
Strings tend to be the easiest kind of data to find. In this case, we expect to find the function names of the program somewhere in the profile. Here’s the main function of the program we profiled:
int main(int argc, char* argv[]) {
  while (true) {
    alpha();
    beta();
    gamma();
    delta();
  }
  return 0;
}
If we’re lucky, we’ll find the string gamma somewhere in plaintext in the .trace bundle. If the data were compressed, we might not be so lucky.
$ grep -r gamma simple-time-profile.trace
Binary file simple-time-profile.trace/form.template matches
Cool, so form.template contains the string gamma in it somewhere. Let’s see what kind of file this is.
$ file simple-time-profile.trace/form.template
simple-time-profile.trace/form.template: Apple binary property list
So what’s this Apple binary property list thing?
Interpreting the plist with plutil
From a Google search, I found an article about converting binary plists, which references a tool called plutil for analyzing and manipulating the contents of binary plists. plutil -p seems especially promising as a way of printing plists in a human readable format.
$ plutil -p simple-time-profile.trace/form.template
{
  "$version" => 100000
  "$objects" => [
    0 => "$null"
    1 => "rsrc://Template - samplertemplate"
    2 => {
      "NSString" => <CFKeyedArchiverUID ...>{value = 3}
      "NSDelegate" => <CFKeyedArchiverUID ...>{value = 0}
      "NSAttributes" => <CFKeyedArchiverUID ...>{value = 5}
      "$class" => <CFKeyedArchiverUID ...>{value = 11}
    }
    ...(many more entries here, excluded for brvity)
  ]
  "$archiver" => "NSKeyedArchiver"
  "$top" => {
    "com.apple.xray.owner.template" => <CFKeyedArchiverUID ...>{value = 12}
    "com.apple.xray.instrument.command" => <CFKeyedArchiverUID ...>{value = 234}
    "$1" => <CFKeyedArchiverUID ...>{value = 163}
    "cliTargetDevice" => <CFKeyedArchiverUID ...>{value = 0}
    "com.apple.xray.owner.template.description" => <CFKeyedArchiverUID ...>{value = 2}
    "$2" => <CFKeyedArchiverUID ...>{value = 164}
    "com.apple.xray.owner.template.version" => 2.1
    "com.apple.xray.owner.template.iconURL" => <CFKeyedArchiverUID ...>{value = 1}
    "$0" => <CFKeyedArchiverUID ...>{value = 141}
    "com.apple.xray.run.data" => <CFKeyedArchiverUID ...>{value = 247}
  }
}
I wasn’t familiar with many Mac APIs, so the best I could do was just Google search some of the terms in here. CFKeyedArchiverUID shows up a lot here, and that sounds related to NSKeyedArchiver.
A Google search tells me that NSKeyedArchiver is an Apple-provided API for serialization and deserialization of object graphs into files. If we can figure out how to reconstruct the object graph that was serialized into this, this might be instrumental in extracting the data we need!
A convenient way to explore Cocoa APIs is inside of an XCode Playground. Inside of a playground, I was able to construct an NSKeyedUnarchiver and start to pull data out of it, but I quickly ran into problems:
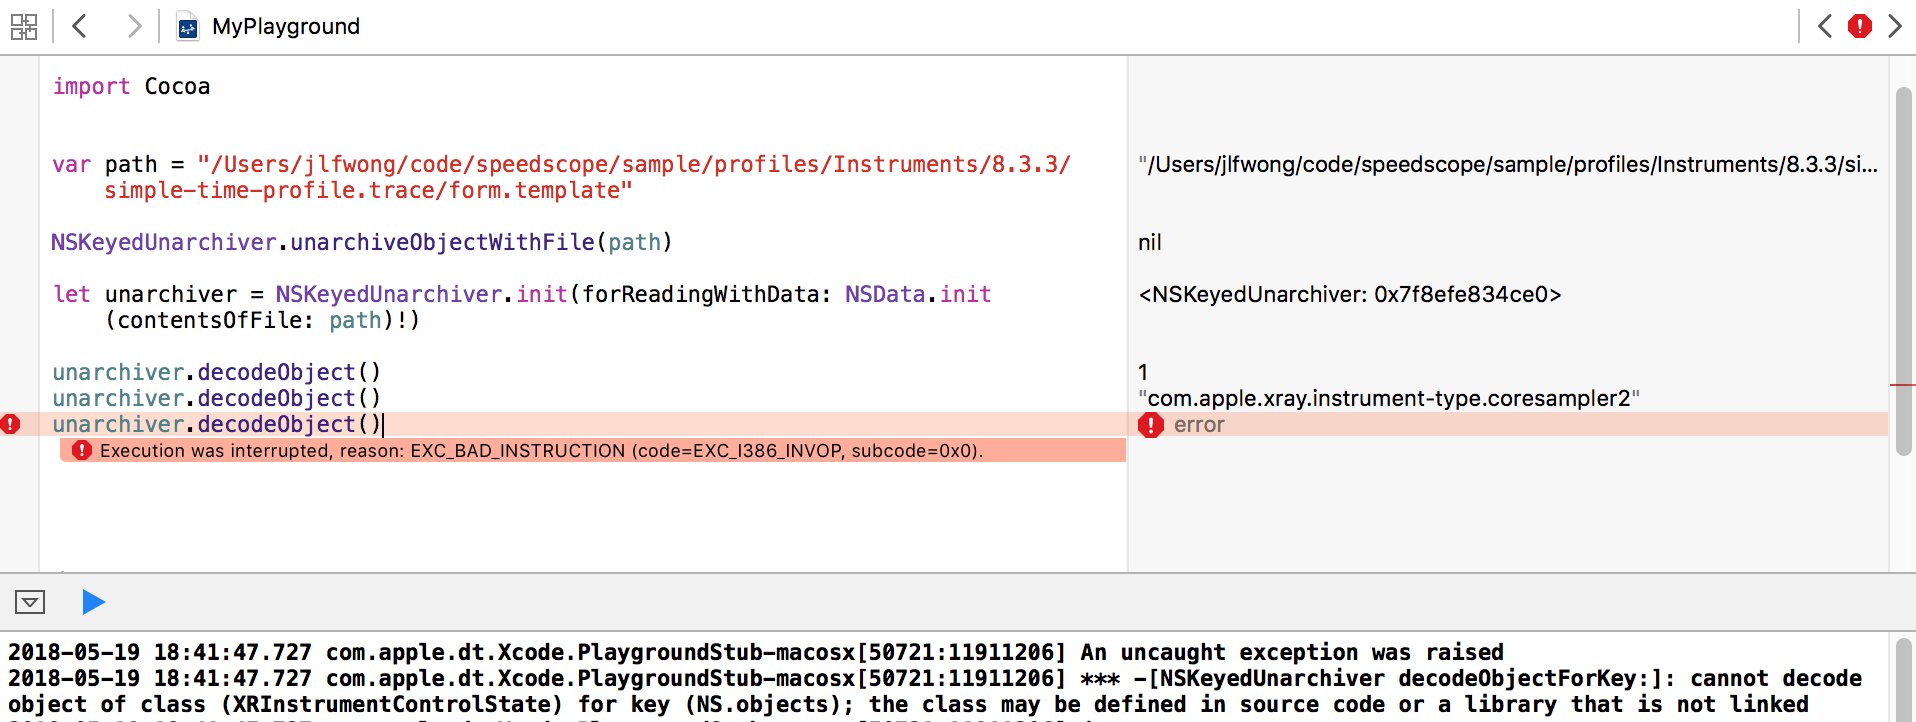
In particular, we have this error:
cannot decode object of class (XRInstrumentControlState) for key (NS.objects);
the class may be defined in source code or a library that is not linked
Unsurprisingly, in order to decode the objects stored within a keyed archive, you need to have access to the classes that were used to encode them. In this case, we don’t have the class XRInstrumentControlState, so the archiver has no idea how to decode it!
We could probably work around this limitation by subclassing NSKeyedUnarchiver and overriding the method which decides which class to decode to based on the class name, but I ultimately want to be able to read these files via JavaScript in the browser where I won’t have access to the Cocoa APIs. Given that, it would be helpful to understand how the serialization format works more directly.
To be able to extract data from this file, we’ll both need to be able to do the same thing as plutil -p is doing above, and also do the same thing as a NSKeyedUnarchiver would be doing in reconstructing the object graph from the plist file.
Making a binary plist parser
Thankfully, parsing binary plists is a problem that many others have encountered in the past. Here are some binary plists parsers in a variety of languages:
- JavaScript: node-bplist-parser
- Java: BinaryPropertyListParser.java
- Python: bplist.py
- Ruby: rbBinaryCFPropertyList.rb
Ultimately, I ended up making minor modifications to a binary plist parser that we use at Figma for Sketch import, which you can now find in the speedscope repository in instruments.ts.
Reconstructing the object graph
Also helpfully, other people have done analysis on how NSKeyedArchiver serializes its data into a property list. This blogpost by mac4n6, for example, explores an example of how an object graph can be reconstructed from the property list. It ends up being a relatively straightforward process of replacing numerical IDs with their corresponding entries in the $object lookup table.
After these replacements are completed, objects will have a property indicating what class they were serialized from. Many common datatypes have consistent serialization formats that we can use to construct a useful representation of the original object.
This too ends up being a task that surprisingly many people have been interested in solving, and have also kindly release source code to solve:
- Python:
ccl_bplist.pyandbpylist.py - JavaScript:
msUnarchiver.js
You can see examples of these in patternMatchObjectiveC in the speedscope source code.
Handling custom datatypes
There are datatypes in simple-time-profile.trace/form.template, however, that are specific to Instruments. When we’re trying to reconstruct an object from an NSKeyedArchive, we’re given a $classname variable. If we collect all the Instruments-specific classnames and print them out, we’re left with this:
[
  "XRRecordingOptions",
  "XRContext",
  "XRAnalysisCoreDetailNode",
  "XRAnalysisCoreTableQuery",
  "XRMainWindowUIState",
  "XRInstrumentControlState",
  "XRRunListData",
  "XRIntKeyedDictionary",
  "PFTPersistentSymbols",
  "XRArchitecture",
  "PFTSymbolData",
  "PFTOwnerData",
  "XRCore",
  "XRThread",
  "XRBacktraceTypeAdapter"
]
Stepping back, what we’re trying to figure out here is where the function names and file locations are stored within this file. From surveying the list of Instruments specific classes above, PFTSymbolData seems like a good candidate to contain this information.
A google search of PFTSymbolData yields this github page showing a reverse-engineered header file from XCode!
@interface PFTSymbolData : NSObject <NSCoding, CommonSymbol, XRUIStackFrame, NSCopying>
{
    NSString *sourcePath;
    struct XRLineNumData *addressData;
    int numAddresses;
    int addressesCapacity;
    BOOL _missingSymbolName;
    struct _CSRange symbolRange;
    unsigned int fTypeFlags;
    PFTOwnerData *ownerData;
    NSMutableArray *inlinedInstances;
    NSString *symbolName;
}
These headers were extracted using class-dump. This was pretty lucky — it just so happens that someone has dumped all of the headers in XCode and put it up in a GitHub repository.
Using the header as a reference and inspecting the data, I was able to reconstruct a semantically useful representation of PFTSymbolData
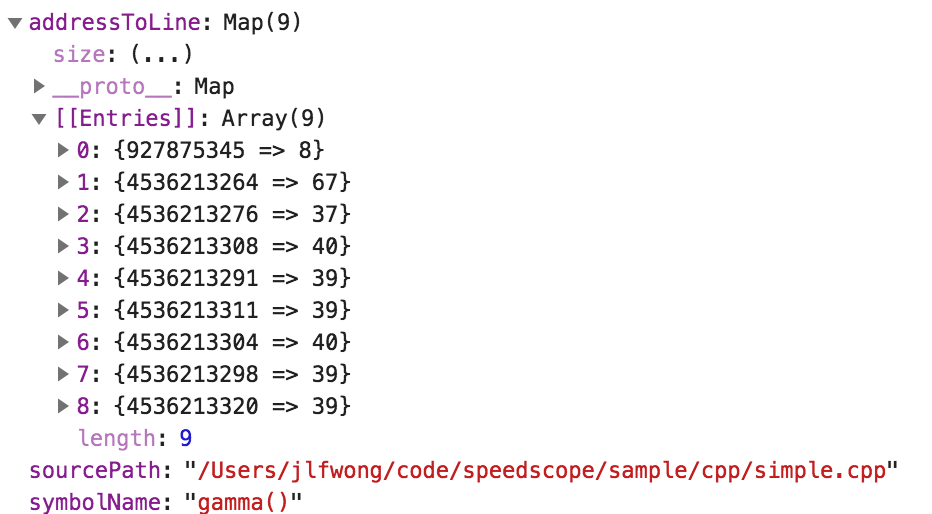
You can see the relevant code in readInstrumentsKeyedArchive.
Now we have the symbol table, but we still need the list of samples!
Finding the list of samples with find and du
I was hoping that all of the information I was interested in would be in a single file within the .trace bundle, but it turns out we aren’t so lucky.
The next thing I’m looking for is the list of samples collected during instrumentation. Each sample contains a timestamp, so I expect them to be stored as a table of numbers. But I wasn’t even sure what numbers I should be looking for, because I’m not sure how the timestamps are stored. The timestamps could be stored as absolute values since unix epoch, or could be stored as relative to the previous sample, or relative to the start of the profile, and could be stored as floating point values or integers, and those integers might be big endian or small endian.
Overall, I wasn’t really sure how to find data when I didn’t know any values that would definitely be in the data table, so I had a different idea for an approach. I recorded a longer profile, then went looking for big files! I figured that as profiles got longer, the data storing the list of samples should get bigger.
To find potential files of interest, I ran the following unix pipeline:
$ find . -type f | xargs du | sort -n | tail -n 10
152     ./corespace/run1/core/stores/indexed-store-9/spindex.0
168     ./corespace/run1/core/stores/indexed-store-12/spindex.0
296     ./corespace/run1/core/stores/indexed-store-3/bulkstore
600     ./form.template
808     ./corespace/run1/core/stores/indexed-store-9/bulkstore
1064    ./corespace/run1/core/stores/indexed-store-12/bulkstore
2048    ./corespace/run1/core/uniquing/arrayUniquer/integeruniquer.data
2048    ./corespace/run1/core/uniquing/typedArrayUniquer/integeruniquer.data
20480   ./corespace/currentRun/core/uniquing/arrayUniquer/integeruniquer.data
20480   ./corespace/currentRun/core/uniquing/typedArrayUniquer/integeruniquer.data
Let’s break down this pipeline.
find . -type ffinds all files in the current directory, printing them one per line (findman page)xargs durunsduto find file size using the list piped to it as arguments usingxargs. We could alternatively dodu $(find . -type f). (xargsman page,duman page)sort -nnumerically sorts the results in ascending order (sortman page`)tail -n 10takes the last 10 lines of output (tailman page)
We can extend this command to tell us the file type of each of these files:
$ find . -type f | xargs du | sort -n | tail -n 10 | cut -f2 | xargs file
./corespace/run1/core/stores/indexed-store-9/spindex.0:                     data
./corespace/run1/core/stores/indexed-store-12/spindex.0:                    data
./corespace/run1/core/stores/indexed-store-3/bulkstore:                     data
./form.template:                                                            Apple binary property list
./corespace/run1/core/stores/indexed-store-9/bulkstore:                     data
./corespace/run1/core/stores/indexed-store-12/bulkstore:                    data
./corespace/run1/core/uniquing/arrayUniquer/integeruniquer.data:            data
./corespace/run1/core/uniquing/typedArrayUniquer/integeruniquer.data:       data
./corespace/currentRun/core/uniquing/arrayUniquer/integeruniquer.data:      data
./corespace/currentRun/core/uniquing/typedArrayUniquer/integeruniquer.data: data
The cut command can be used to extract columns of data from a plaintext table. In this case cut -f2 selects only the second column of the data. We then run the file command on each resulting file. (cut man page)
A file type of data isn’t very informative, so we’ll have to start examining the binary contents to figure out the format ourselves.
Exploring binary file contents with xxd
xxd is a tool for taking a “hex dump” of a binary file (xxd man page). A hex dump of a binary file is a representation of a file displaying each byte of the file as a hexadecimal pair.
$ echo "hello" | xxd
00000000: 6865 6c6c 6f0a                           hello.
The output here shows the offset (00000000:), the hex represenation of the bytes in the file (6865 6c6c 6f0a) and the corresponding ASCII interpretation of those bytes (hello.), with . being used in place of unprintable characters. The . in this case corresponds to the byte 0a which in turn corresponds to the ASCII \n character emitted by echo.
Here’s another example using printf to emit 3 bytes with no printable representations.
$ printf "\1\2\3" | xxd
00000000: 0102 03                                  ...
Let’s use this to explore the biggest file we found.
$ xxd corespace/currentRun/core/uniquing/typedArrayUniquer/integeruniquer.data | head -n 10
00000000: 6745 2301 7e33 0a00 0100 0000 0000 0000  gE#.~3..........
00000010: 0100 0000 0000 0000 0000 0000 0000 0000  ................
00000020: 0000 0000 0000 0000 0000 0000 0000 0000  ................
00000030: 0000 0000 0000 0000 0000 0000 0000 0000  ................
00000040: 0000 0000 0000 0000 0000 0000 0000 0000  ................
00000050: 0000 0000 0000 0000 0000 0000 0000 0000  ................
00000060: 0000 0000 0000 0000 0000 0000 0000 0000  ................
00000070: 0000 0000 0000 0000 0000 0000 0000 0000  ................
00000080: 0000 0000 0000 0000 0000 0000 0000 0000  ................
00000090: 0000 0000 0000 0000 0000 0000 0000 0000  ................
Hmm. It seems like there’s a lot of data in this file that’s all zero’d out. The sample list can’t possibly be all zeros, so we’d rather just look for bits that aren’t zero’d out. The -a flag of xxd can be of help in this situation.
       -a | -autoskip
              toggle autoskip: A single '*' replaces nul-lines.  Default off.


$ xxd -a ./corespace/currentRun/core/uniquing/typedArrayUniquer/integeruniquer.data
00000000: 6745 2301 7e33 0a00 0100 0000 0000 0000  gE#.~3..........
00000010: 0100 0000 0000 0000 0000 0000 0000 0000  ................
00000020: 0000 0000 0000 0000 0000 0000 0000 0000  ................
*
009ffff0: 0000 0000 0000 0000 0000 0000 0000 0000  ................
Welp. It doesn’t seem like this file actually contains much useful data. Let’s re-sort our list of files, this time sorting by the number of non-null lines.
$ for f in $(find . -type f); do echo "$(xxd -a $f | wc -l) $f"; done | sort -n | tail -n 10
    1337 ./corespace/currentRun/core/extensions/com.apple.dt.instruments.ktrace.dtac/knowledge-rules-0.clp
    1337 ./corespace/run1/core/extensions/com.apple.dt.instruments.ktrace.dtac/knowledge-rules-0.clp
    2232 ./corespace/currentRun/core/extensions/com.apple.dt.instruments.poi.dtac/binding-rules.clp
    2232 ./corespace/run1/core/extensions/com.apple.dt.instruments.poi.dtac/binding-rules.clp
    2391 ./corespace/run1/core/uniquing/arrayUniquer/integeruniquer.data
    2524 ./corespace/run1/core/stores/indexed-store-12/spindex.0
    2736 ./corespace/run1/core/stores/indexed-store-9/spindex.0
    5148 ./corespace/run1/core/stores/indexed-store-9/bulkstore
    6793 ./corespace/run1/core/stores/indexed-store-12/bulkstore
   18091 ./form.template
We already know what form.template is, so we’ll start with the second largest. If we look at indexed-store-12/bulkestore, it looks like there might be some useful data in there, starting at offset 0x1000.
$ xxd -a ./corespace/run1/core/stores/indexed-store-12/bulkstore | head -n 20
00000000: 0a0a 3412 0300 0000 2800 0000 0010 0000  ..4.....(.......
00000010: 2100 0000 0040 0800 0040 0000 0000 0000  !....@...@......
00000020: 0000 0000 0000 0000 0000 0000 0000 0000  ................
*
00001000: 796c 8f2b 0000 0400 0000 0000 0006 0000  yl.+............
00001010: 0004 0000 0040 420f 0000 0000 00fe 0000  .....@B.........
00001020: 00a4 9ddc 2b00 0004 0000 0000 0000 0200  ....+...........
00001030: 0000 0400 0000 4042 0f00 0000 0000 0001  ......@B........
00001040: 0000 5d7f 0a2c 0000 0400 0000 0000 0002  ..]..,..........
00001050: 0000 0004 0000 0040 420f 0000 0000 0002  .......@B.......
00001060: 0100 0039 fb19 2c00 0004 0000 0000 0000  ...9..,.........
00001070: 0000 0000 0400 0000 4042 0f00 0000 0000  ........@B......
00001080: 0401 0000 336b 292c 0000 0400 0000 0000  ....3k),........
00001090: 0000 0000 0004 0000 0040 420f 0000 0000  .........@B.....
000010a0: 0005 0100 0026 e538 2c00 0004 0000 0000  .....&.8,.......
000010b0: 0000 0000 0000 0400 0000 4042 0f00 0000  ..........@B....
000010c0: 0000 0701 0000 4c5a 482c 0000 0400 0000  ......LZH,......
000010d0: 0000 0000 0000 0004 0000 0040 420f 0000  ...........@B...
000010e0: 0000 0009 0100 0040 ce57 2c00 0004 0000  .......@.W,.....
000010f0: 0000 0000 0000 0000 0400 0000 4042 0f00  ............@B..
The @B in the right column, while not obviously semantically meaningful, seems to repeat at a regular interval. Maybe if can figure out that regular interval, we’ll be able to guess what the structure of the data is. We can try guessing different intervals by using the -c argument of xxd, and try changing the byte grouping using the -g argument.
      -c cols | -cols cols
              format <cols> octets per line. Default 16 (-i: 12, -ps: 30, -b: 6).

     -g bytes | -groupsize bytes
              separate the output of every <bytes> bytes (two hex characters or eight bit-digits each) by a whitespace.  Specify -g 0 to suppress grouping.
We seem to get alignment between the repeated values when we group data into chunks of 33:
$ xxd -a -c 33 -g0 ./corespace/run1/core/stores/indexed-store-12/bulkstore | cut -d' ' -f2 | head -n 10
0a0a34120300000028000000001000002100000000400800004000000000000000
000000000000000000000000000000000000000000000000000000000000000000
*
00000000796c8f2b000004000000000000060000000400000040420f0000000000
fe000000a49ddc2b000004000000000000020000000400000040420f0000000000
000100005d7f0a2c000004000000000000020000000400000040420f0000000000
0201000039fb192c000004000000000000000000000400000040420f0000000000
04010000336b292c000004000000000000000000000400000040420f0000000000
0501000026e5382c000004000000000000000000000400000040420f0000000000
070100004c5a482c000004000000000000000000000400000040420f0000000000
Sweet! This suggests that this file format uses 33 bytes per entry, and hopefully each of those entries corresponds to one sample in the profile.
Looking around in the directory which contains this bulkstore, we find a helpful sounding file called schema.xml:
$ cat ./corespace/run1/core/stores/indexed-store-12/schema.xml
<schema name="time-profile" topology="XRT50_C22_TypeID">
    <column engineeringType="XRSampleTimestampTypeID" engineeringName="Sample Time" mnemonic="time" topologyField="XRTraceRelativeTimestampFieldID"></column>
    <column engineeringType="XRThreadTypeID" engineeringName="Thread" mnemonic="thread" topologyField="XRCategory1FieldID"></column>
    <column engineeringType="XRProcessTypeID" engineeringName="Process" mnemonic="process"></column>
    <column engineeringType="XRCPUCoreTypeID" engineeringName="Core" mnemonic="core"></column>
    <column engineeringType="XRThreadStateTypeID" engineeringName="State" mnemonic="thread-state"></column>
    <column engineeringType="XRTimeSampleWeightTypeID" engineeringName="Weight" mnemonic="weight"></column>
    <column engineeringType="XRBacktraceTypeID" engineeringName="Stack" mnemonic="stack"></column>
</schema>
Alright, this is looking pretty good! XRSampleTimestampTypeID and XRBacktraceTypeID seem particularly relevant.
The next step is to figure out how these 33 byte entries map onto the fields in schema.xml.
Guessing binary formats with Synalyze It!
So far in this exploration, all of the tools I’ve been using come standard on most unix installations, and all are free and open source. While I certainly could have figured this out end-to-end using only tools in that category, my friend Peter Sobot introduced me to a tool that made this process much easier.
Synalyze It! is a hex editor and binary analysis tool for OS X. There’s a Windows & Linux version called Hexinator. These tools let you make guesses about the structure of file formats (e.g. “I think this file is a list of structs, each of which is 20 bytes, where the first 4 bytes are an unsigned int, and the last 16 bytes are a fixed-length ascii string”), then parse the file based on that guess and display in both a colorized view of the hex dump and in an expandable tree view. This let me guess-and-check several hypotheses about what the structure of the file.
Eventually I was able to guess the length and offsets of the fields I was interested in. Synalyze It! helps you visually parse the information by setting colors for different fields. Here, I’ve set the sample timestamp to be green, and the backtrace ID to be red.
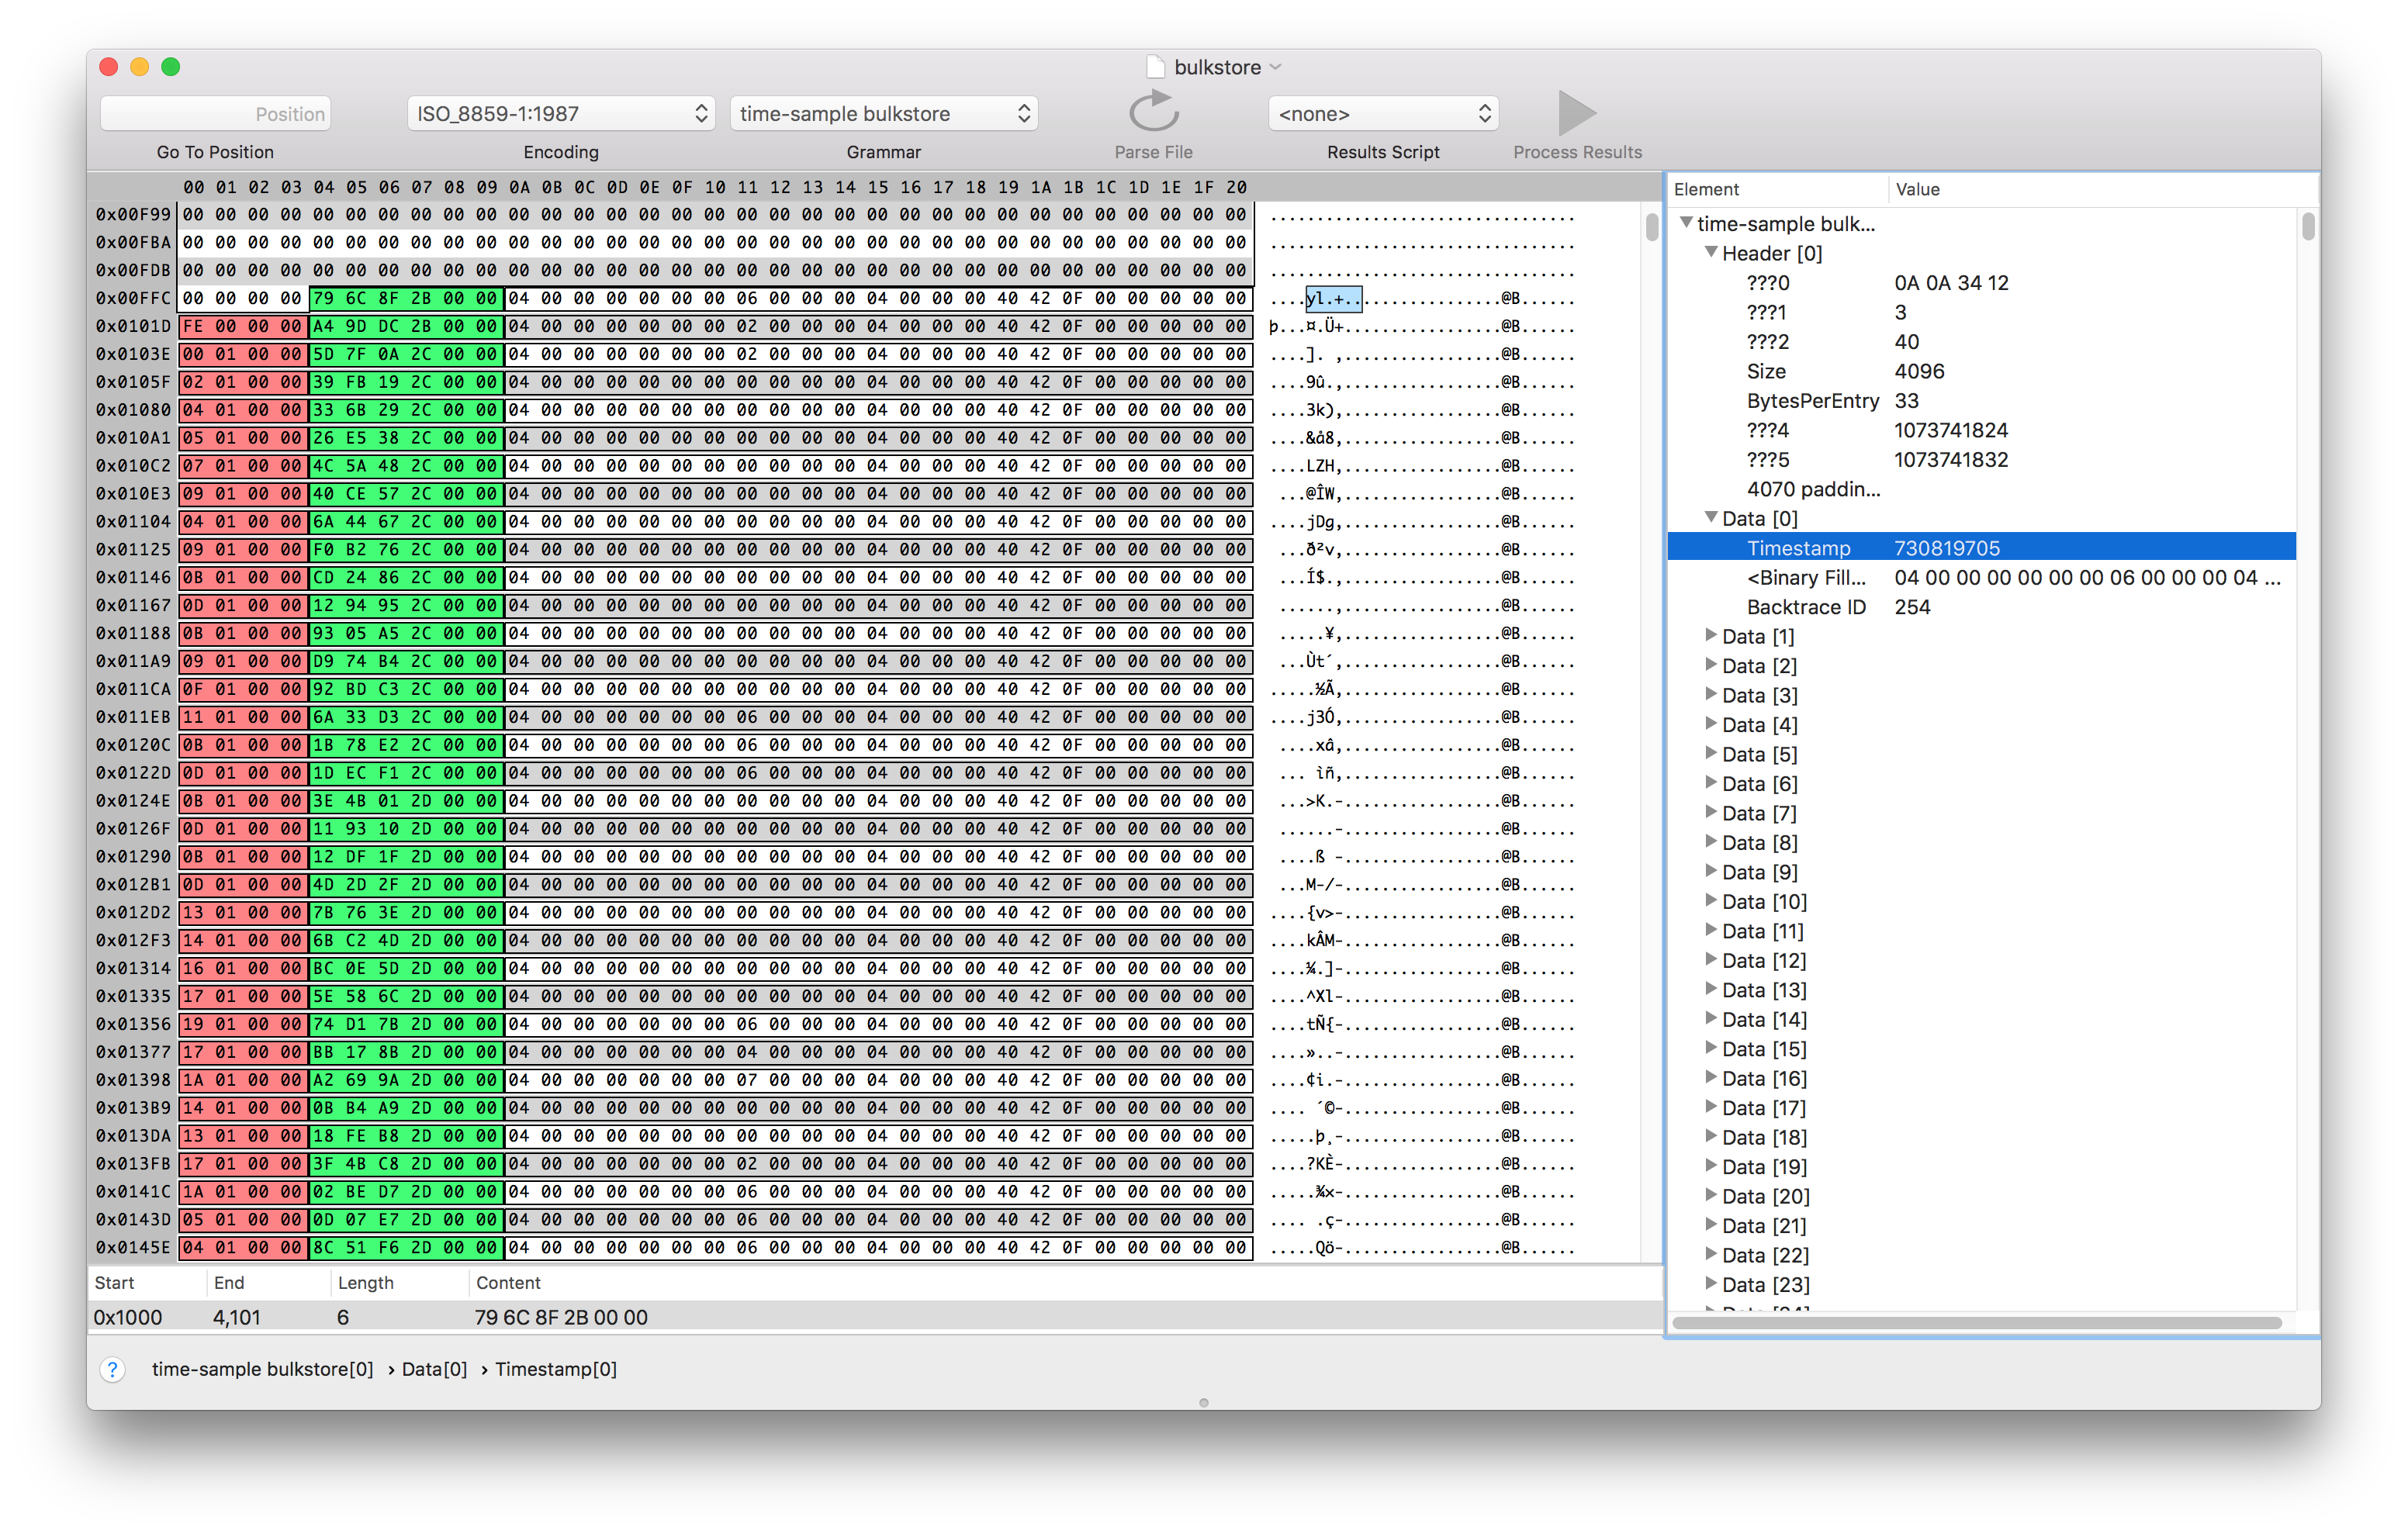
From looking at the values of the sample time and comparing them with what Instruments was displaying, I was able to infer that the values represented the number of nanoseconds since the profile started as a six byte unsigned integer. I was able to verify this by editing the binary file and then re-opening it in instruments.
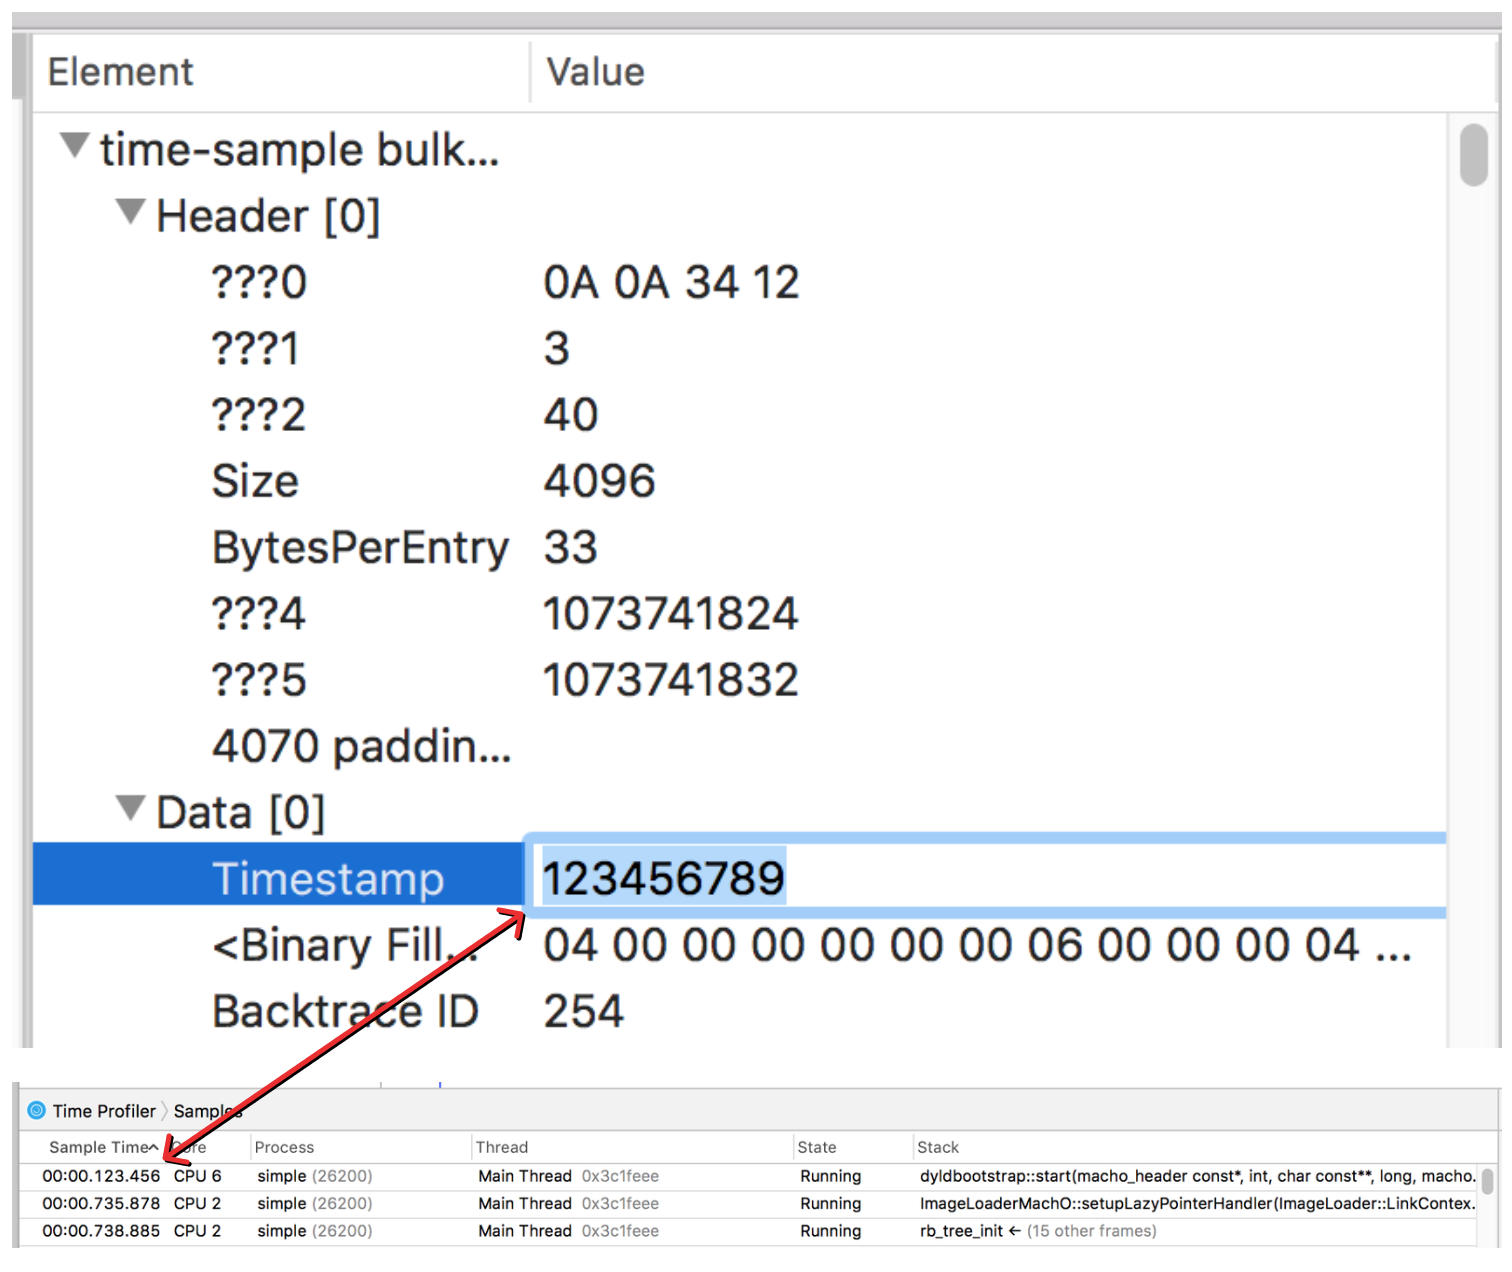
Sweet! So that answers the question of where the sample information is stored, and we know how to interpret the timestamp data. But we still don’t quite know how to turn the backtrace ID into a stack trace.
To try to find the stacks, we can see if the memory addresses identified as part of the symbol table show up anywhere outside of the form.template binary plist.
Finding binary sequences using python
Here’s the same symbol data from earlier.

So let’s see if we can find one of these addresses referenced somewhere else in the .trace bundle. We’ll look for the third address in that list, 4536213276.
As a first attempt, it’s possible that the number is written as a string.
$ grep -a -R -l '4536213276' .
No results. Well, that was kind of a long shot. Let’s try the more plausible idea of searching for a binary encoding of this number.
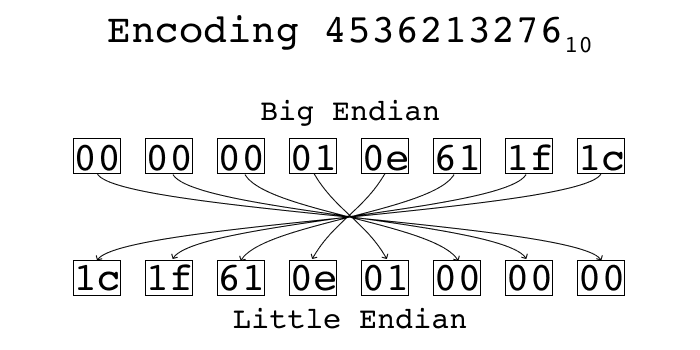
There are two standard ways of encoding multi-byte integers into a byte stream. One is called “little endian” and the other is called “big endian”. In little endian, you place the least significant byte first. In big endian, you place the most significant byte first. Using python’s struct standard library, we can see what each of these representations look like.
The number is too big to fit in a 32 bit integer, so it’s probably a 64 bit integer, which would make sense if it’s a memory address that has to support 64 bit addresses.
$ python -c 'import struct, sys; sys.stdout.write(struct.pack(">Q", 4536213276));' | xxd
00000000: 0000 0001 0e61 1f1c                      .....a..
$ python -c 'import struct, sys; sys.stdout.write(struct.pack("<Q", 4536213276));' | xxd
00000000: 1c1f 610e 0100 0000                      ..a.....
>Q instructs struct.pack to encode the number as a big endian 64 bit unsigned integer, and <Q corresponds to a little endian 64 bit unsigned integer.
If you split up the bytes, you can see it’s the same bytes in both encodings, just in reverse order:
Now we can use a little python program to search for files with the value we care about.
$ cat search.py
import os, glob, struct

addr = 4536213276
little = struct.pack('<Q', addr)
big = struct.pack('>Q', addr)

for (dirpath, dirnames, filenames) in os.walk('.'):
  for f in filenames:
    path = os.path.join(dirpath, f)
    contents = open(path).read()
    if little in contents:
      print 'Found little in %s' % path
    elif big in contents:
      print 'Found big in %s' % path
$ python search.py
Found big in ./form.template
Found little in ./corespace/run1/core/uniquing/arrayUniquer/integeruniquer.data
Sweet! The value is in two places: one little endian, one big endian. The form.template one we already knew about — that’s where we found this address in the first place. The second location in integeruniquer.data is one we haven’t explored. It also was one of the files we found when searching for files with large amounts of non-zero data in them.
After fumbling around in this file with Synalyze It! for a while, I discovered that file is aptly named, and contains arrays of integers packed as a 32 bit length followed by a list of 64 bit integers.
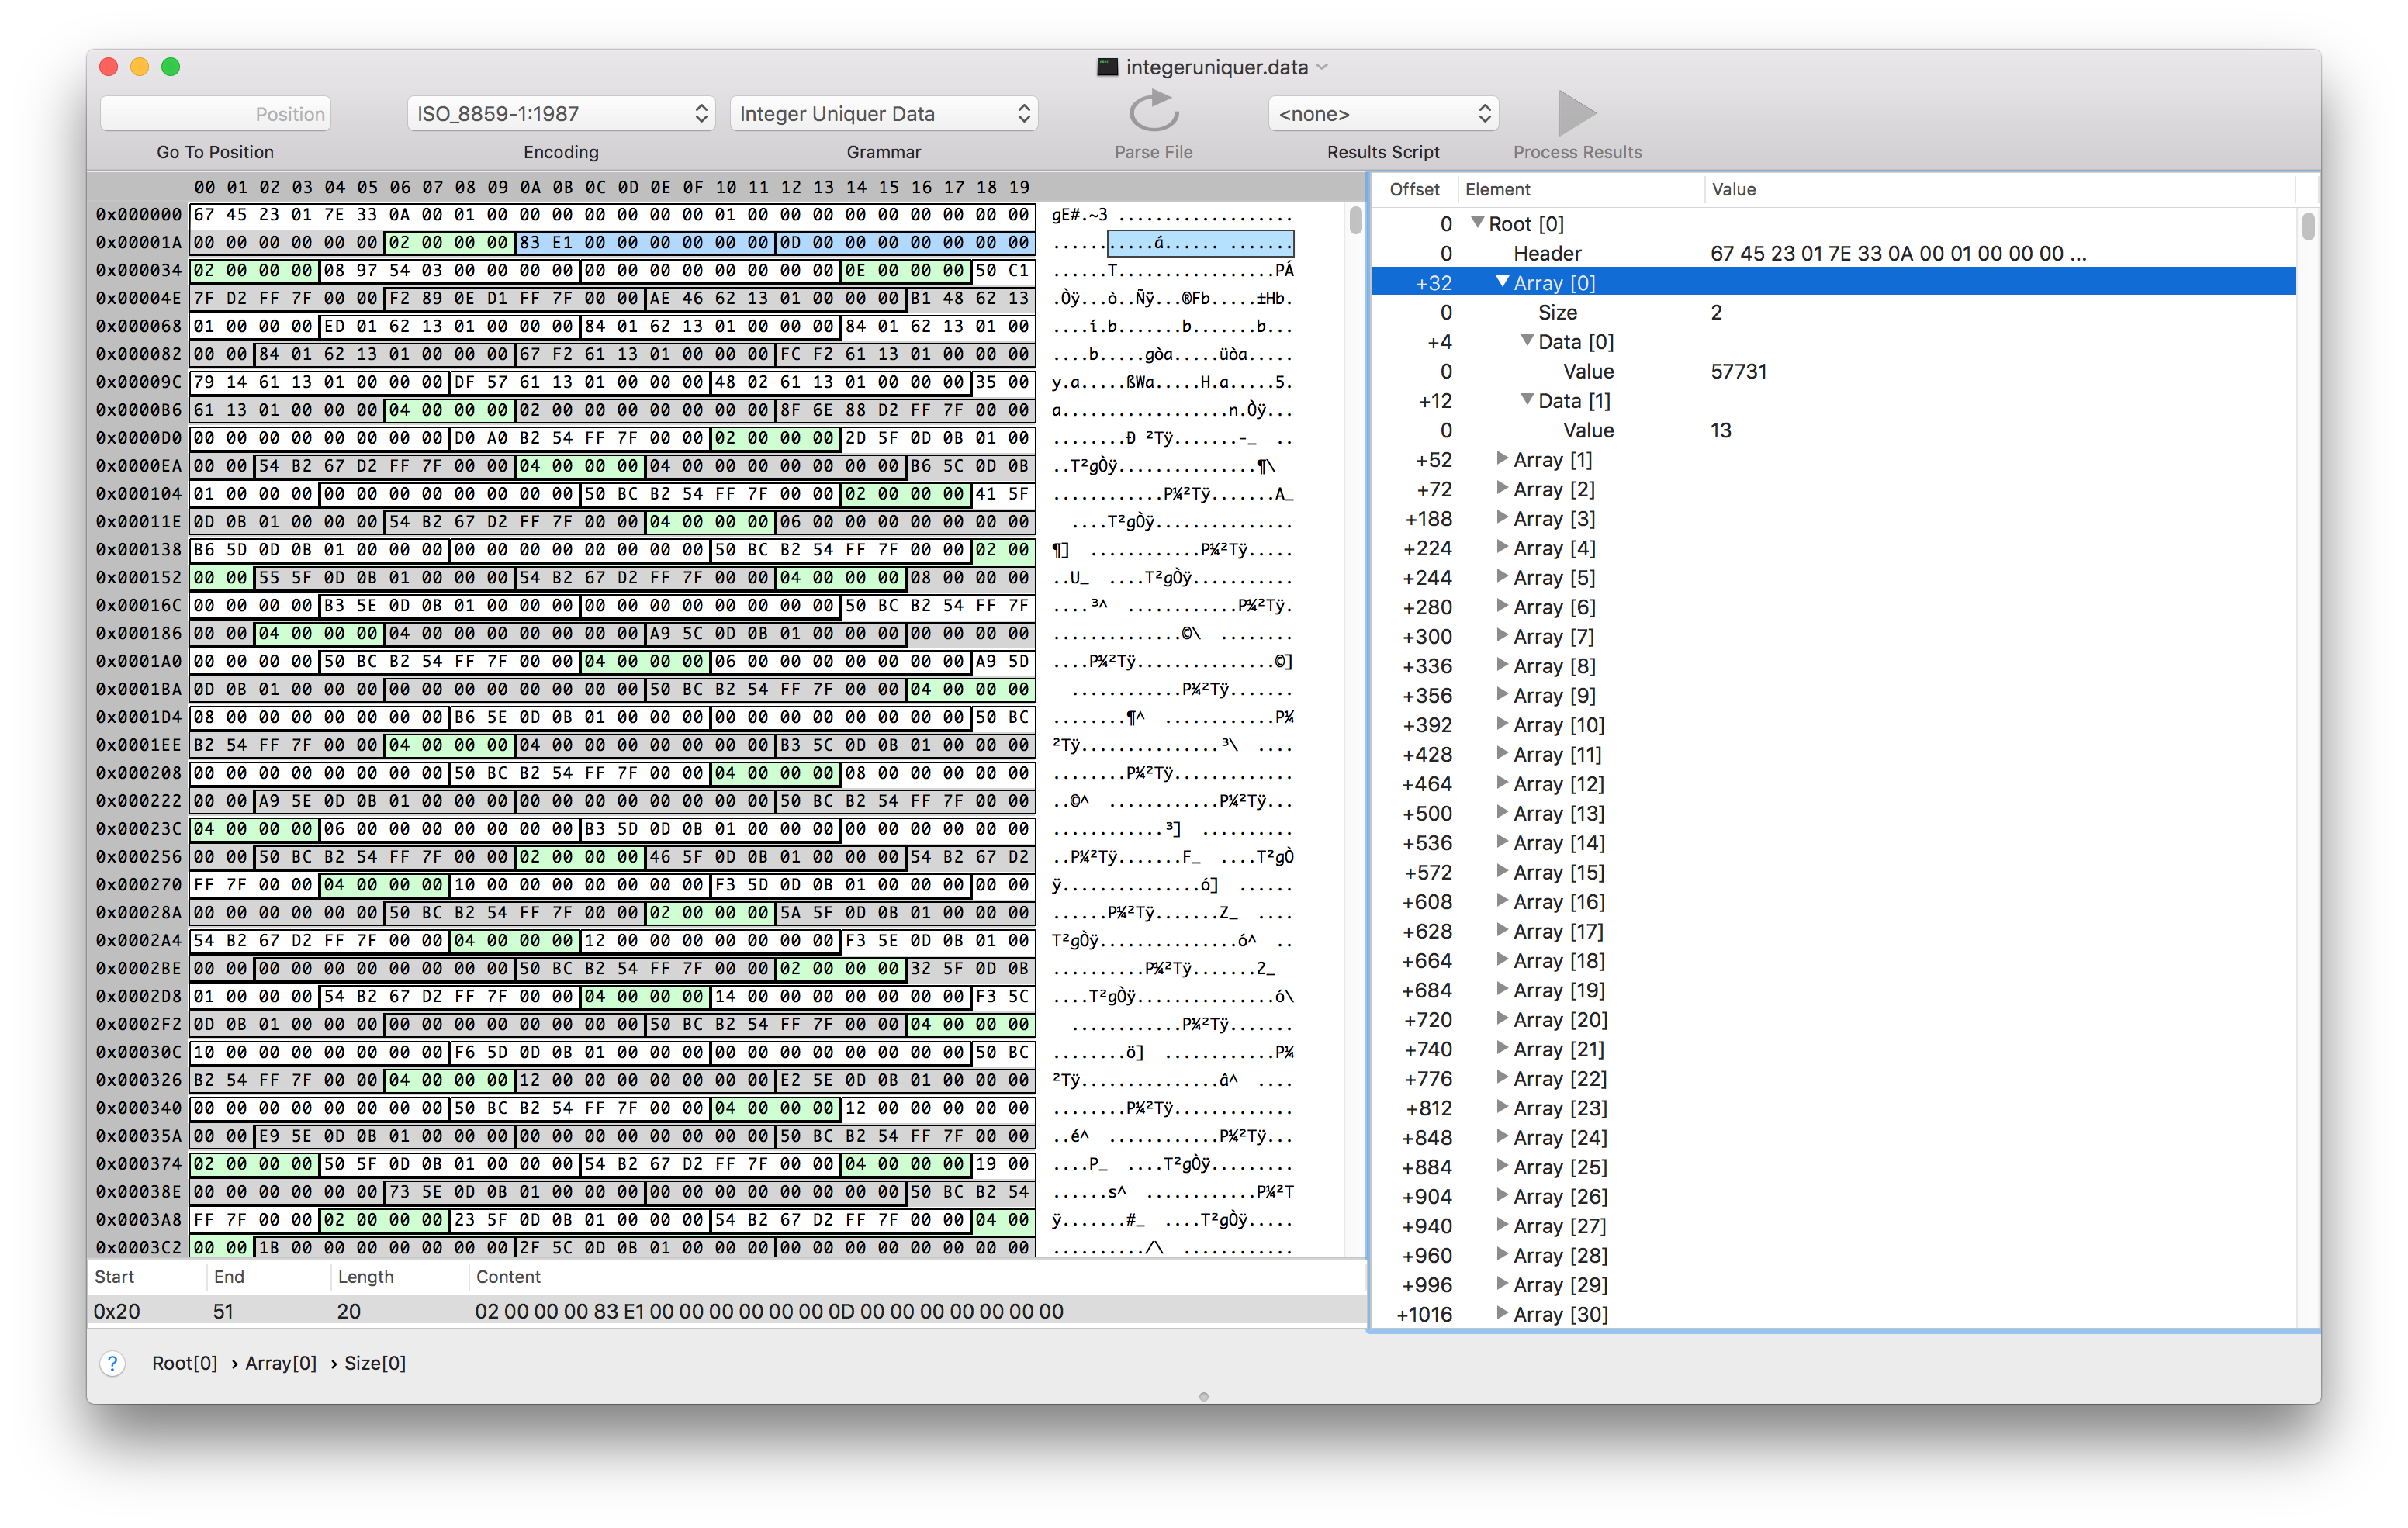
So integeruniquer.data contains an array of arrays of 64 bit integers. Neat!
It seems like each 64 bit int is either a memory address or an index into the array of arrays. This was the last piece of the puzzle we need to parse the profiles.
Putting it all together
So overall, the final process looks like this:
- Find the list of samples by finding a
bulkstorefile adjacent to aschema.xmlwhich contains the string<schema name="time-profile". - Extract a list of
(timestamp, backtraceID)tuples from thebulkstore - Using the
backtraceIDas an index into the array represented byarrayUniquer/integeruniquer.data, convert the list of(timestamp, backtraceID)tuples into a list of(timestamp, address[])tuples - Parse the
form.templatebinary plist and extract the symbol data fromPFTSymbolDatafrom the resultingNSKeyedArchive. Convert this into a mapping fromaddressto(function name, file path)pairs. - Using the
address → (function name, file path)mapping in conjunction with the(timestamp address[])tuple list, construct a list of(timestamp, (function name, file path)[])tuples. This is the final information needed to construct a flamegraph!
Phew! That was a lot of digging for what ultimately ends up being a relatively straightforward data extraction. You can find the implementation in importFromInstrumentsTrace in the source for speedscope on GitHub.
If you do get the chance to give speedscope a try, please tweet @jlfwong and let me know what you think 🙂.
Thanks to Peter Sobot, Ryan Kaplan, and Rudi Chen for providing feedback on the draft of this post.