speedscope - Interactive Flamegraph Explorer
An edited version of this post was written for Mozilla Hacks: Cross-language Performance Profile Exploration with speedscope.
For the past 9 months, I’ve been working on speedscope: a fast, interactive, web-based viewer for large performance profiles. You can use it live at www.speedscope.app, and read the code on GitHub at jlfwong/speedscope.
It’s inspired by the performance panel of Chrome developer tools and by Brendan Gregg’s FlameGraphs. If you’ve never heard of flamegraphs before or have heard of them but never understood how to read them, the guide “Using flamegraphs” from rbspy’s documentation is wonderful.
The goal of speedscope is to provide a 60fps way of interactively exploring large performance profiles from a variety of sources. It runs totally in-browser, and does not send any profiling data to any servers. Because it runs in-browser, it should work in Chrome and Firefox on Mac, Windows, and Linux (though I’ve only actually tested on Mac 😬).
You can use it offline via the command-line if you install it via npm.
npm install -g speedscope
Or you can just download a zipfile from the GitHub releases page and open the contained index.html directly if you don’t want to deal with node or npm.
Currently supported import sources include:
- JavaScript
- Ruby
- Native code
- Importing from Instruments.app (macOS)
- Importing from
perf(linux)
speedscope also provides two ways of importing from custom sources. Check out Importing from custom sources for the details. If you’d like to see support for an additional format, please submit an issue, and ideally contribute that support!
speedscope is MIT licensed.
What can it do?
speedscope is broken down into three primary views: Time Order, Left Heavy, and Sandwich.
🕰Time Order
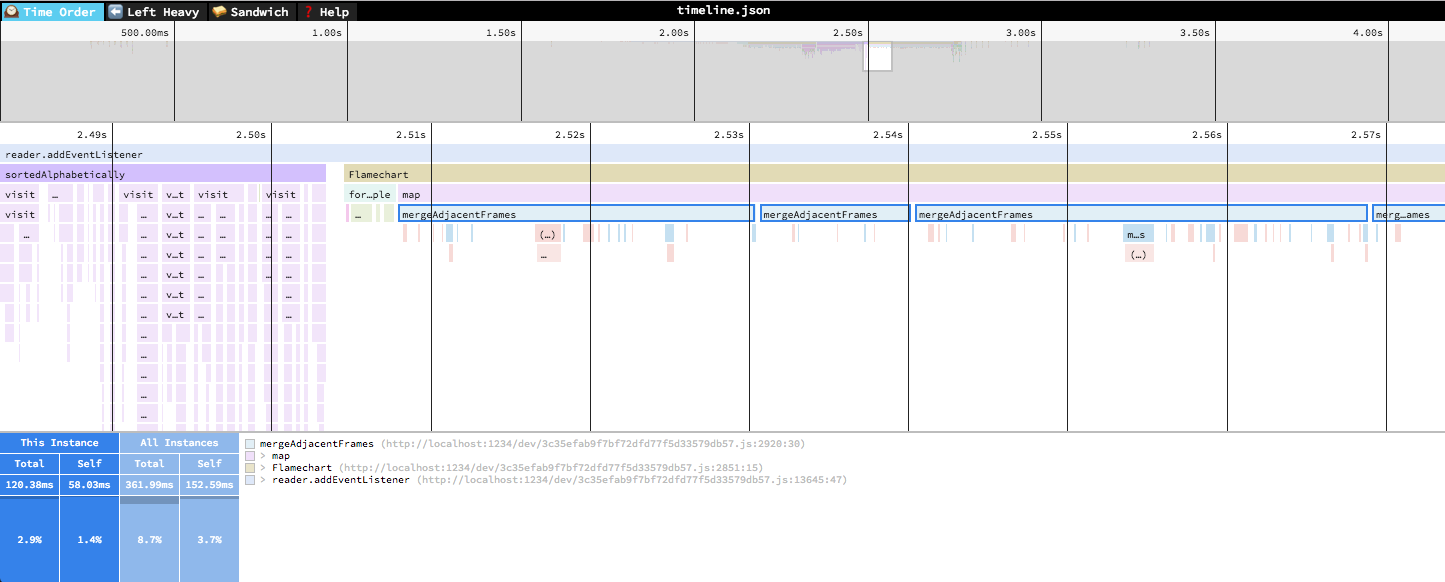
In the “Time Order” view (the default), call stacks are ordered left-to-right in the same order as they occurred in the input file, which is usually going to be the chronological order they were recorded in. This view is most helpful for understanding the behavior of an application over time, e.g. “first the data is fetched from the database, then the data is prepared for serialization, then the data is serialized to JSON”.
The horizontal axis represents the “weight” of each stack (most commonly CPU time), and the vertical axis shows you the stack active at the time of the sample. If you click on one of the frames, you’ll be able to see summary statistics about it.
⬅️Left Heavy
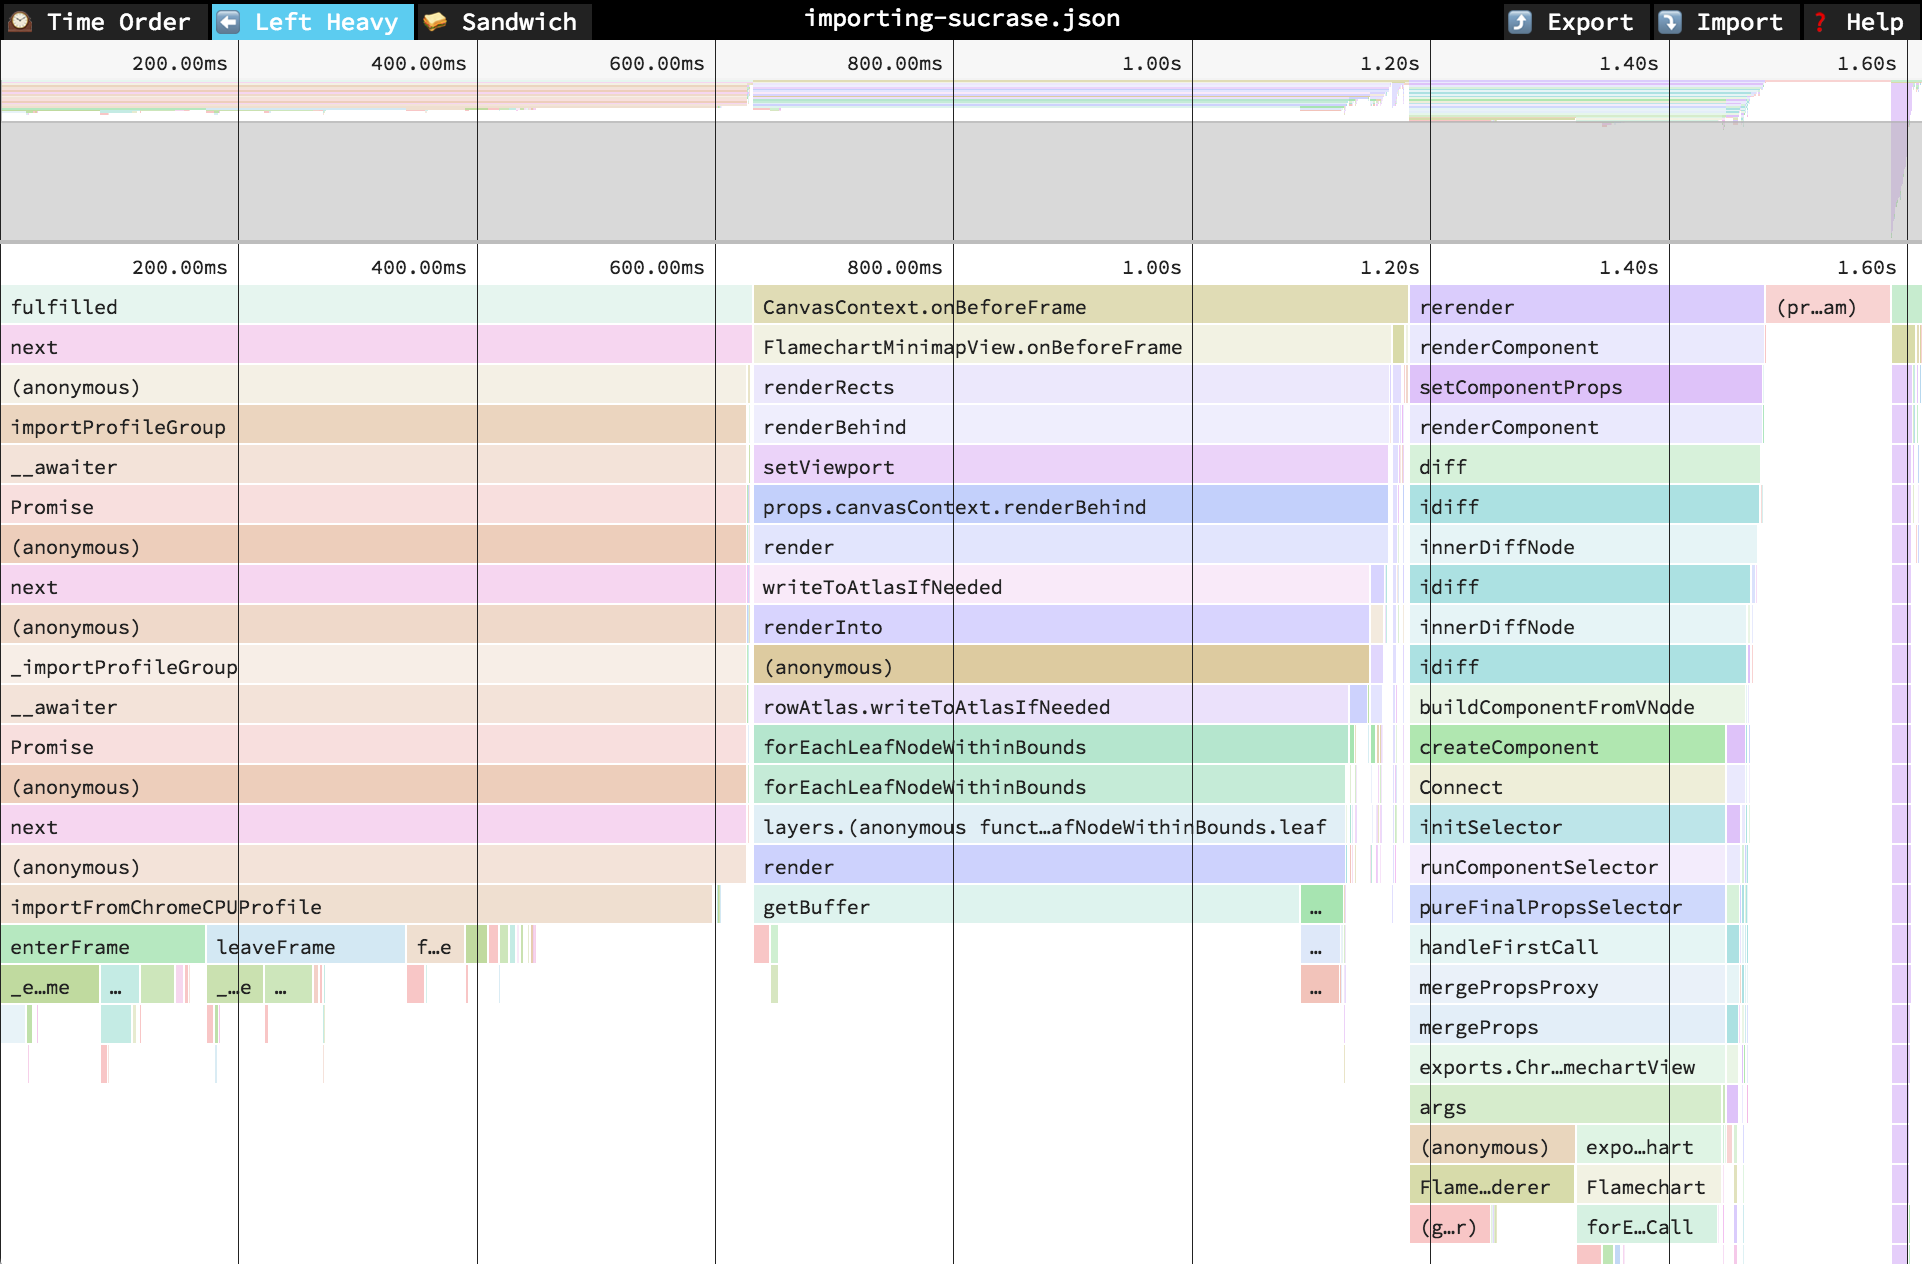
In the “Left Heavy” view, identical stacks are grouped together, regardless of whether they were recorded sequentially. Then, the stacks are sorted so that the heaviest stack for each parent is on the left – hence “left heavy”. This view is useful for understanding where all the time is going in situations where there are hundreds or thousands of function calls interleaved between other call stacks.
🥪 Sandwich
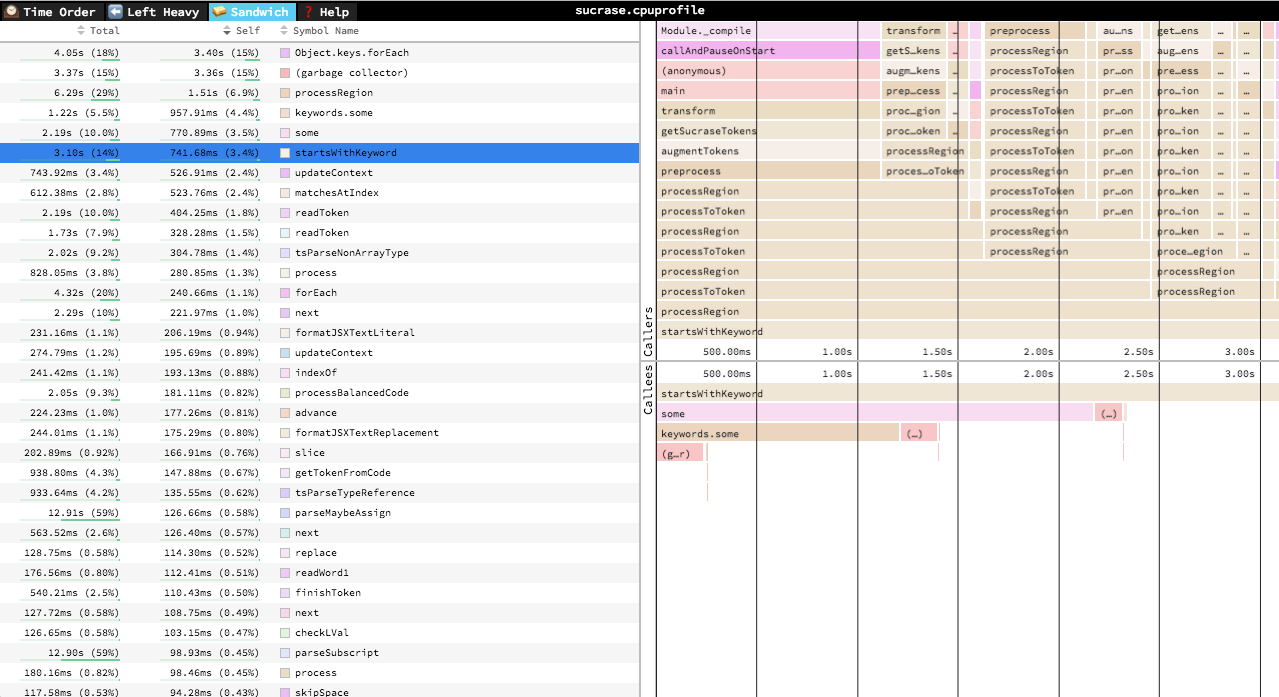
The “Sandwich” view is a table view in which you can find a list of all functions and their associated times. You can sort by self time or total time.
It’s called the “Sandwich” view because if you select one of the rows in the table, you can see flamegraphs for all the callers and callees of the selected row.
Who’s using it?
I haven’t done too much to advertise speedscope, but it’s already in use in at least three companies!
Figma
We’ve been using speedscope at Figma for all kinds of performance analysis for our user interface design tool. This is a bit of a cheat because I work at Figma, but it spread from initially a tool that only I used to a tool that’s in use by most people on the teams that work in C++ or TypeScript for performance analysis. One particular superpower that speedscope gives us is the ability to get users to record performance profiles in Chrome containing minified names, then remap the stack traces back to development symbols using the .symbols file generated by emscripten. We’ve been using it for months now to help us optimize loading time in particular, and regularly use it to load 100MB+ profiles exported from Chrome.
Benchling
Engineers at Benchling have been using it thanks to Alan Pierce using it to implement a really easy-to-use profiler for their backend Python code.
We recently worked on a project to make backend profiling easier and more accessible, and speedscope has been an important part of that. Now anyone in the company (not just engineers) can take a profile anytime they see something slow in any production instance, post a speedscope link to Slack, and anyone on engineering can help out in the analysis and share insights or ideas for improvements. As one recent example, speedscope recently made it easy to see that a slow operation spent almost all of its time building and running regexes, and switching to Python’s
string.findwhen possible sped the operation up by about 75x.
Uber
Rudro Samanta and teammates have been using speedscope at Uber to visualize profiles of iOS applications captured via Xcode & Instruments.
Instruments is great at finding a specific hotspot function across a long running trace of our app (e.g. Font loading – UIFont fontWithName is slow). With speedscope we’re able to find that during this specific transition from one screen to the other, this specific icon load appears to take up more time than we expected and maybe we should pre-load that one large icon or something.
Architecture
While working on speedscope, I tried to stay generally light on dependencies, opting to implement a lot of stuff from scratch rather than trying to glue a bunch of third party libraries together. This serves two major purposes:
- Small download size. At time of writing, the total compressed download size of https://www.speedscope.app/ is 131KB, and only the first 63KB of that is needed before the page becomes usefully interactive. This fully loads in just under 2.5s over a Fast 3G connection.
- Re-inventing the wheel teaches me stuff. This might not be the best strategy for getting product in front of users as fast as possible, but I certainly learn a lot more doing this. As part of speedscope, I implemented a basic linear algebra math library, pan/zoom mechanics, a least-recently-used cache, and an efficient list view, among other things. I feel much better about how I spent the time designing & implementing those than I would have if I spent that time learning the specific APIs of other people’s implementations.
That said, there were a few dependencies that were gnarly enough that I didn’t want to roll my own.
- Preact for declaratively defining UI views. I generally really enjoy working with React, but wanted a smaller library in terms of byte size since one of my goals was to make speedscope load really fast even from an empty cache on a slow connection.
- Aphrodite for authoring CSS. This deals with all the auto-prefixing for me, avoids classes of bugs around CSS prioritization conflicts, and works nicely with TypeScript, which I’ve really thoroughly enjoyed using for this project. I have a bias here vs. other CSS solutions since I co-authored the first version of Aphrodite while at Khan Academy, so I understand how it works ☺️.
- Redux and preact-redux for global in-memory state management. I honestly started trying to implement my own global state management solution for speedscope since redux felt like a lot of unnecessarily complexity for what I was trying to do, but I repeatedly ran into bugs or complications that led me back to redux. I ultimately left with a greater appreciation for redux.
- Pako for extracting zlib encoded data as part of importing trace files from Instruments. I probably would’ve learned a lot implementing my own decompressor, but it seems like something pretty easy to get wrong, and it’s a pretty small dependency.
- graphics.ts is a WebGL abstraction layer that I ported from https://github.com/evanw/sky. speedscope uses WebGL for flamegraph rendering, which is how it ends up being so fast even for massive profiles. Before that I was using regl, which was delightful for the most part. I ultimately needed to switch away from it because it uses
eval, which would preclude speedscope from being usable in environments with a strictContent-Security-Policyheader. See https://github.com/regl-project/regl/issues/491#issuecomment-414146457.
As a quick note about build and test infrastructure, speedscope uses Jest for writing tests, Travis CI for continuous integration, Coveralls for test code coverage reporting, Parcel for source code → build artifact transformation, and prettier for automatic code formatting.
What’s next?
Working on speedscope has provided me a bounty of blogpost material. Working on it led me to writing both “Color: From Hexcodes to Eyeballs” and “Reverse Engineering Intruments’ File Format”, and there’s a lot more material I could extract from this project to write about.
In terms of spreading speedscope to wherever it can be useful, there are two major paths: increasing the number of formats that speedscope can import, and making tighter integrations into speedscope to make the import process seamless. For instance, I have an open PR on stackprof to make it the default visualization tool that ships with the profiler.
In terms of increasing the capabilities of speedscope itself, one path forward would be to support a wider array of visualizations to e.g. be able to visualize network requests & CPU time on the same time axis, just like Chrome developer tools does. In an extreme version of this, you could imagine importing complex traces from distributed systems and exploring them interactively.
Buuuuuut I think I’m probably going to take a long break before trying to do any of that (though I’m still happy to do code review if someone else wants to!) Let me explain why.
At the beginning of the year, I finished reading 7 Habits of Highly Effective People, and wrote down my personal mission statement broken down by the different roles I care about: friend, son, brother, student, teacher, etc. Part of what led me to focusing on speedscope for the last 9 months was this part of my mission statement:
As an engineer, I will work to build maintainable, understandable systems and tools which aid people in solving problems of essential complexity in the world.
I feel confident that speedscope does contribute to that goal in a small way. But I think that I’ve let too much of my time drift towards this. While I like working on speedscope, it’s a mostly solitary endeavor, and even if I was collaborating with other people, I already spend ~40 hours doing satisfying engineering work at Figma. I think I’d like to reclaim more of my time to pursuing creative, collaborative endeavors with other people where most of that collaboration doesn’t happen through a sheet of glass. So that’s likely where most of my time is going to go for the rest of this year. This stuff comes in waves, so perhaps I’ll return to sinking a ton more time into this some time in the future.
Part of what I like about side projects and having my own blog is not needing to keep working on stuff when I don’t really feel like it, and not needing to pretend that the work is my lifeblood. While I’m proud of a lot of the technical stuff I’ve written on my blog, I’m ultimately most proud of my post about my experience with depression, because it expresses a distinctly human perspective that I rarely take the time to express.
Welp, this “product launch” post took a weirdly personal turn near the end. If you got this far, here’s a music video from one of my favorite artists 😃.